
Determination of expresssion of HER2 in Breast Cancer
The overexpression of HER2 occurs in approximately 20 to 25 percent of breast cancers and is associated with increased disease recurrence, short survival, and poor prognosis. In addition, HER2 status is correlated with resistance to certain chemotherapeutic agents. Patients with HER2+ breast cancer require special treatments, such as trastuzumab [Herceptin] and lapatinib. Routine testing of Her2 status is routine for most women with breast cancer because the results may affect treatment recommendations. Currently, there are only two validated techniques available for routine diagnosis of HER2 status: IHC analysis and FISH testing. Both methods are time consuming and can only be performed on excised tissue in vitro.
This project seeks to develop Raman spectroscopy technique to provide accurate real-time determination of HER2 status in breast cancer. In a previous pilot study, the feasibility of Raman in assessment of HER2 status was explored by investigating different cell lines using a benchtop Raman micro-spectroscopy system (Figure 1). Raman spectra collected from HER2+ human breast cancer cells were compared to those from HER2+ and HER2- controls (Figure 2). Significant differences among cell lines were observed in the signature regions tentatively assigned to lipid, protein and nucleic acids. HER2+ cancer cells were differentiated with the HER2+ and HER2- controls with an overall sensitivity of 100 percent and specificity of 99 percent. Ongoing research includes understanding the mechanism of obtained drug resistance in HER2+ breast cancer and bringing our technique to in vivo measurements in animal models (Figure 3) and patients.
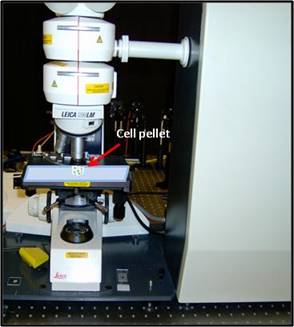
Figure 1 (left): Raman Micro-spectroscopy couples a Raman spectrometer with a confocal microscope and a 785 nm laser source. Cells were washed off culture media with saline and water, and centrifuged to get a pellet. Raman spectra were collected from the cell pellets with ten seconds exposure time and two accumulations.
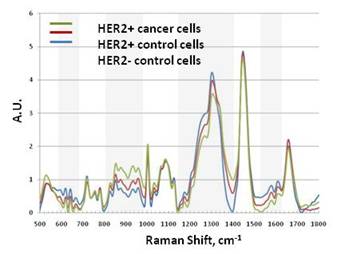
Figure 2: Raman spectra from three cell lines. The grey boxes mark the regions where differences among cell lines were observed.
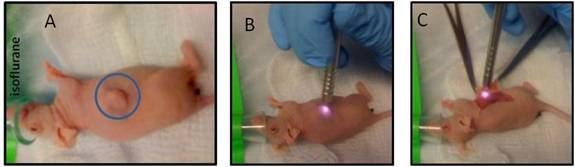
Figure 3 (above): Demonstration of Raman probe used for in vivo spectra collection in a mouse model of breast cancer. Human breast cancer cells were injected into the mammary fat pad of null mice. The blue circle on Figure 3A marked the location of developed tumor one month post injection. Raman spectra were collected by shining the laser via a fiber optic probe on the tumor through the skin (3B) or on open skin (3C).
References
X. Bi, B. Rexer, C. L. Arteaga, M. Guo, M. Li, A. Mahadevan-Jansen, Determination of HER2 amplification status in breast cancer cells using Raman spectroscopy, 2010, Proc. SPIE, Vol. 7560, 7560-30 (2010).