Cody, Karly A.; Sokołowski, Andrzej; Johns, Emily; Guerra, Lucah Medina; Winer, Joseph R.; Young, Christina B.; Younes, Kyan; Dumitrescu, Logan C.; Archer, Derek B.; Durant, Alaina; Sathe, Aditi; Koran, Mary Ellen Irene; Mez, Jesse B.; Saykin, Andrew J.; Toga, Arthur W.; Cuccaro, Michael L.; Tosun, Duygu; Insel, Philip S.; Johnson, Sterling C.; Harrison, Theresa M.; Hohman, Timothy J.; & Mormino, Elizabeth C. (2026). Characterizing amyloid and tau positron emission tomography-based stages across the clinical continuum. Alzheimer’s and Dementia, 22(1), e71017. https://doi.org/10.1002/alz.71017
We analyzed positron emission tomography (PET) scans from multiple studies to understand how amyloid and tau proteins, which are linked to Alzheimer’s disease, vary across different stages of cognitive decline. The study included over 10,000 participants, ranging from cognitively unimpaired individuals to those with mild cognitive impairment or dementia. Amyloid levels tended to increase with age among people without symptoms or with mild impairment, while very high amyloid levels were most common in those with dementia. In a subset of participants with tau PET scans, tau protein levels increased with both amyloid levels and clinical severity, with complex patterns related to age. Importantly, within each clinical stage, there was a wide range of amyloid and tau levels, showing that brain pathology can vary greatly even among people with similar cognitive status. This work demonstrates that PET scans can be standardized across different studies and tracers, revealing the heterogeneous nature of amyloid and tau accumulation along the continuum of cognitive decline.
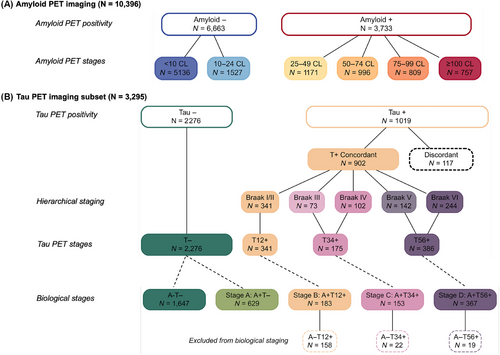
FIGURE 1
Amyloid and tau positron emission tomography (PET) staging. (A) Distribution of amyloid PET status, where positivity was determined as ≥25 CL, and amyloid PET staging, determined using six CL-based bins in the study sample (n = 10,396). (B) Breakdown of tau PET and biological staging for subset of individuals from (A) who also underwent tau PET imaging (n = 3295). Tau-positive individuals were assessed for concordance with Braak hierarchical staging. Those who followed the hierarchical staging were grouped into four hierarchical tau PET stages (e.g., T−, T12+, T34+, and T56+). These tau PET stages were then used to operationalize the PET-based biological stages for AD (Jack et al.), which require amyloid positivity for disease staging. Boxes with a dashed outline were excluded from staging schemas. A±, amyloid PET positivity; CL, Centiloid; T±, tau PET positivity.