Pourmotabbed, Haatef, Martin, Caroline G., Goodale, Sarah E., Doss, Derek J., Wang, Shiyu, Bayrak, Roza G., Kang, Hakmook, Morgan, Victoria L., Englot, Dario J., & Chang, Catie E. (2025). “Multimodal state-dependent connectivity analysis of arousal and autonomic centers in the brainstem and basal forebrain.” Imaging Neuroscience, 3, IMAG.a.91. https://doi.org/10.1162/IMAG.a.91
Vigilance, or how alert and awake we are, constantly changes and affects our thinking and behavior. This state can be disrupted in many brain disorders. Certain areas deep in the brain, called neuromodulatory nuclei in the brainstem and basal forebrain, help regulate alertness and drive widespread brain activity and communication. However, it is not well understood how the brain’s large-scale networks change when we shift between being alert and drowsy.
In this study, we used simultaneous EEG (which measures brain electrical activity) and advanced fMRI scans to explore how these arousal centers connect with other parts of the brain depending on vigilance. We found that when people are drowsy, most of these nuclei show stronger global connections, especially to regions like the thalamus, precuneus, and sensory and motor areas. When people are more alert, the nuclei connect most strongly to networks involved in attention, internal thought, and hearing. These patterns remained consistent even after controlling for blood flow effects.
To confirm our findings, we analyzed two large brain imaging datasets and showed that these connectivity patterns are reproducible across different types of fMRI scans. Overall, this study provides new insights into how brain regions that regulate arousal influence large-scale brain activity depending on our level of alertness.
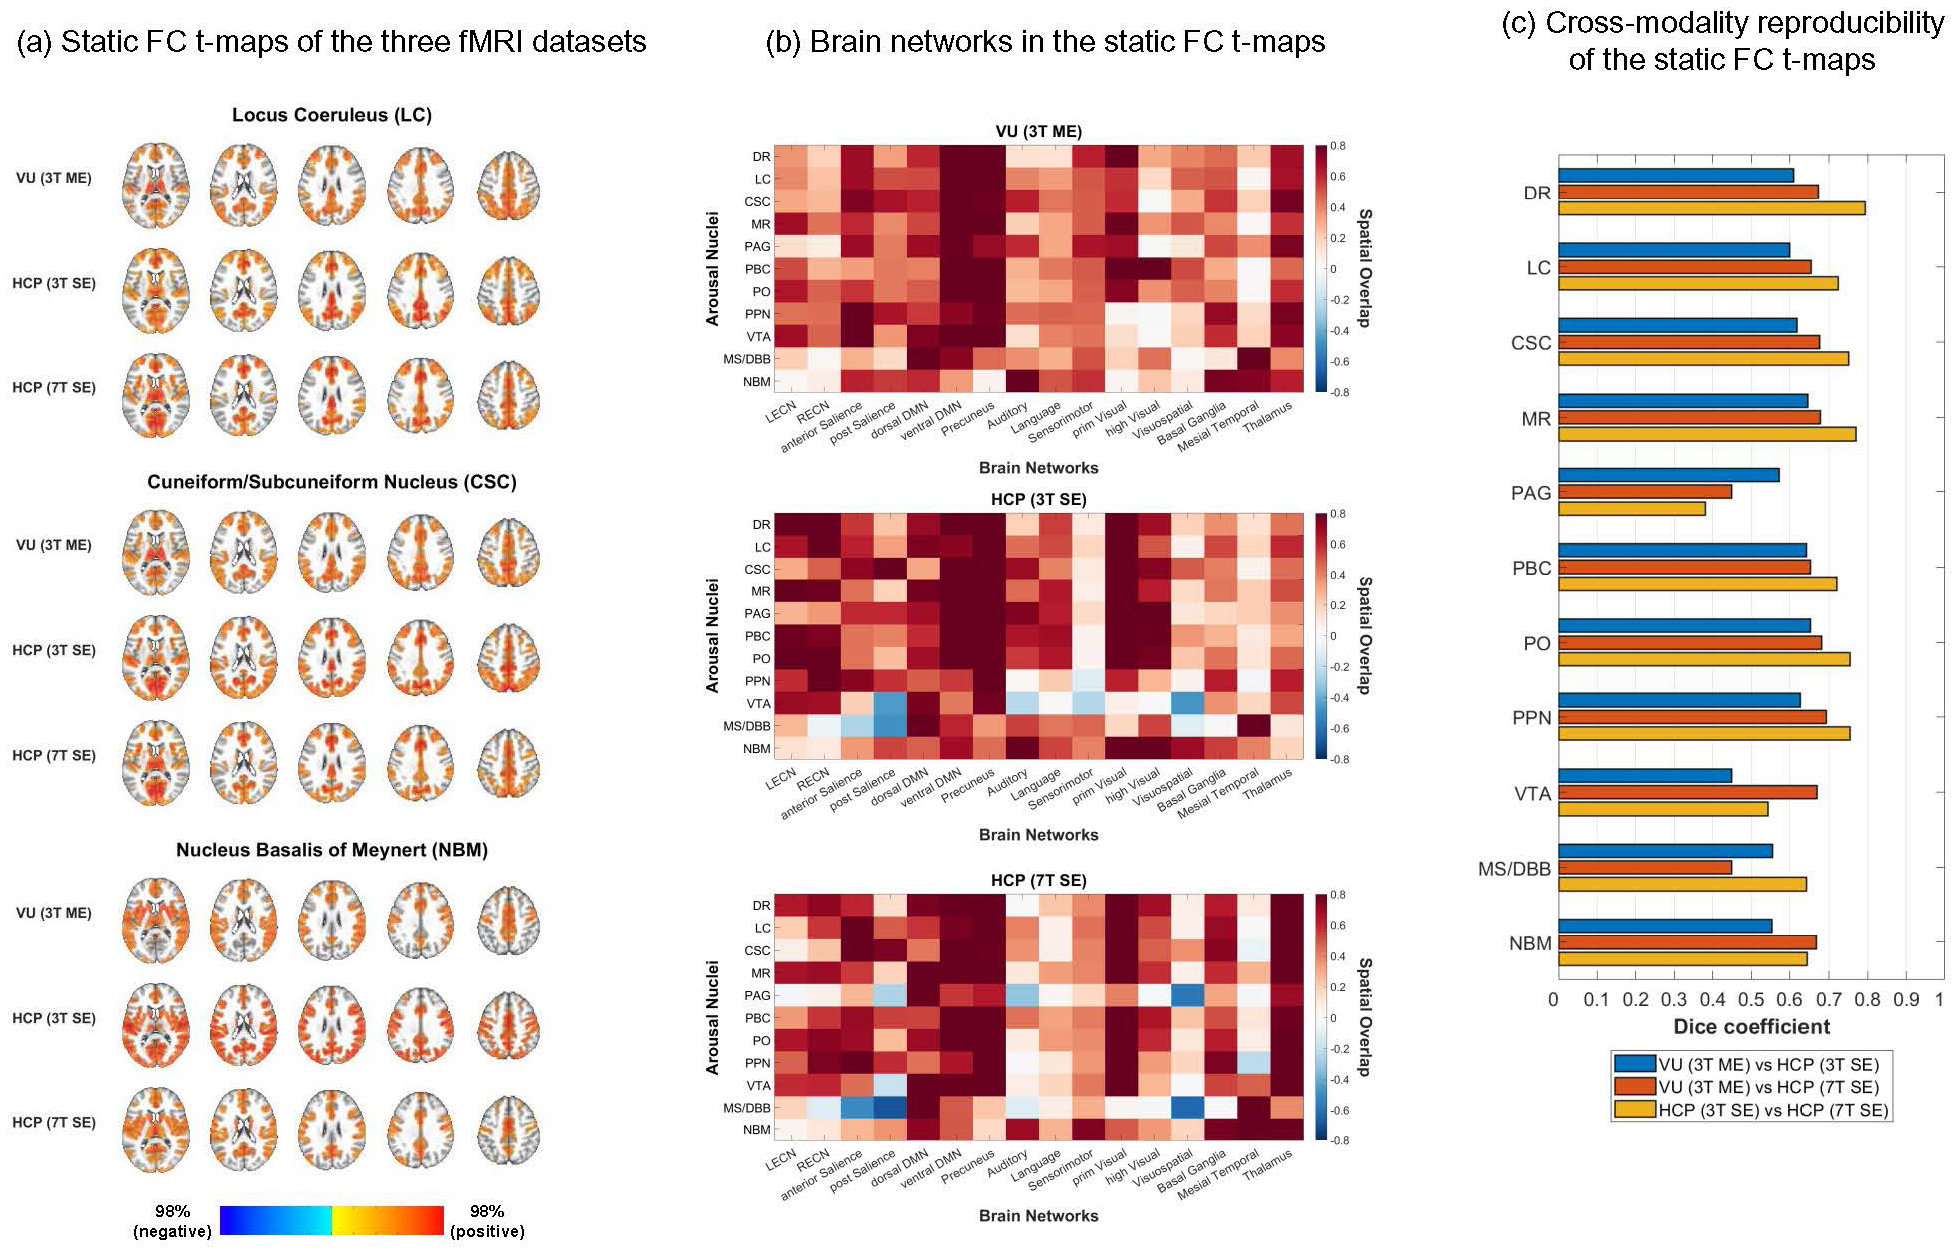
Fig 1 – Reproducible static connectivity profiles of neuromodulatory arousal centers. (a) Static functional connectivity (FC) t-maps of the locus coresuleus (LC), cuneiform/subcuneiform nucleus (CSC), and nucleus basalis of Meynert (NBM) in the VU 3T-ME, HCP 3T, and HCP 7T datasets for the mCSF/WM preprocessing pipeline. The FC t-maps were thresholded at 40% of the top t-values in the gray matter and at p < 0.05 (voxel-wise false discovery rate [FDR]-corrected over the entire gray matter volume). AFNI was used for visualization of the t-maps (@chauffeur_afni function; upper functional range set to the 98th percentile). (b) Spatial overlap of the thresholded static FC t-maps of the subcortical arousal regions with 16 canonical brain network templates from the FINDLAB and Melbourne atlases (Shirer et al., 2012; Tian et al., 2020). A positive value for the spatial overlap corresponds to mostly positive correlations within the brain network template while a negative value corresponds to mostly negative correlations. (c) Spatial reproducibility (Dice similarity coefficient) of the thresholded static FC t-maps between the three fMRI datasets.