Vasudev, Anusha; Moore, Colin R.; Calindi, Aparna; Kang, Seung-woo; Helm, Bryan R.; Srinivasan, Jayashree; Shah, Siddhartha; Zong, Ruiting; Singarapu, Nandini; Casey, Scott; Macintyre, Andrew N.; Lau, Ken S.; Hale, Laura P.; Liu, Qi; Manley, Nancy Ruth; Ehrlich, Lauren I. Richie; & Richie, Ellen Rothman. (2025). Coordinated changes in stromal and hematopoietic cells that define the perinatal to juvenile transition in the mouse thymus. Cell Reports, 44(12), 116677. https://doi.org/10.1016/j.celrep.2025.116677
Perinatal T cells have unique features that may be shaped by changes in the thymus’s supporting stromal cells. In mice, researchers studied thymic cells from birth to one month using gene profiling, flow cytometry, and imaging. They found major changes around 7–14 days, when the thymus shifts from growth to maintenance. During this time, genes for cell growth decrease, while genes for immune signaling increase. These changes are linked to higher T cell self-reactivity and stronger regulatory T cell function. Overall, the thymus remodels during this transition, which likely affects how T cells develop. The data also provide a resource for studying the perinatal thymus.
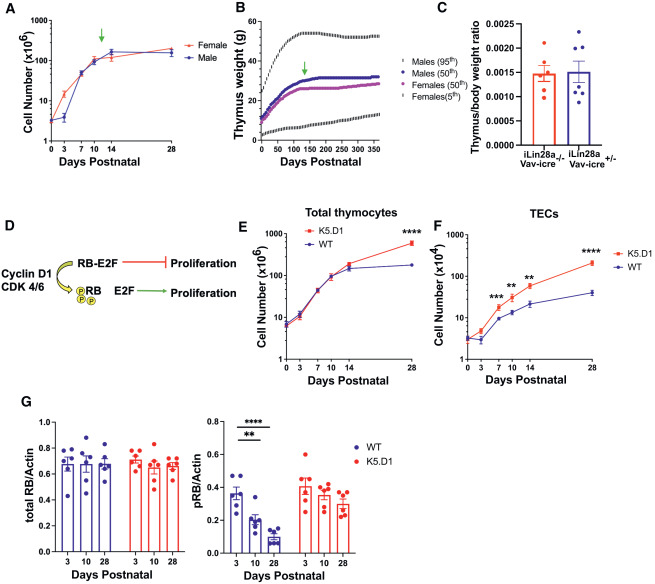
Figure 1 Cyclin D1-RB-E2F pathway regulates the transition from perinatal thymus expansion to juvenile homeostasis
(A) Thymocyte cellularity (mean ± SEM) in male versus female C57BL/6J mice. Green arrow indicates the transition from thymus growth to homeostasis. Data compiled from ≥3 experiments/age. n = 2–14 mice/sex/age.
(B) Human thymus weight based on previously published percentile charts.19 Thymus weight at 50th percentile males (blue) and females (pink); thymus weight at 95th (males) and 5th percentile (females). n = 563 males; 407 females.
(C) Thymus to body weight ratio (mean ± SEM) in 5-week-old Vav-iCre+/−;R26iLin28a mice and Vav-iCre−/−;R26iLin28a controls, n = 6–7 mice/genotype. Statistical analysis performed using unpaired t test, ∗p < 0.05, ∗∗p < 0.01, ∗∗∗p < 0.001, and ∗∗∗∗p < 0.0001.
(D) Simplified schematic of cyclin D1-RB-E2F axis.
(E and F) Total thymocyte (E) and TEC cellularity (F) (mean ± SEM) in WT and K5.D1 mice. Data pooled from ≥3 experiments/age group; n = 9–32 mice/genotype/age.
(G) Quantification (mean ± SEM) of western blot data showing the ratio of total or phosphorylated RB (pRB) to actin in WT and K5.D1 TECs. Each dot represents one experiment; 3 mice/experiment; 6 independent experiments/age/genotype.
For Figures 1A, 1E, and 1F, statistical analysis used multiple t tests; unpaired t test per age group with Holm-Šídák method. Figure 1G used one-way ANOVA with Tukey’s multiple comparisons test. ∗p < 0.05, ∗∗p < 0.01, ∗∗∗p < 0.001, and ∗∗∗∗p < 0.0001.