Naseri, Mohammad Yunus, Snyder, Caitlin, Biswas, Gautam, Henrick, Erin C., Hotchkiss, Erin R., Jha, Manoj Kumar, Jiang, Steven, Kern, Emily C., Lohani, Vinod K., Marston, Landon T., Vanags, C. P., & Xia, Kang. (2025). Student and instructor perceptions of data science integration into science and engineering courses. European Journal of Engineering Education. https://doi.org/10.1080/03043797.2025.2573223
Data science skills are increasingly important for undergraduate students in engineering and science, but it can be challenging to integrate these skills effectively into existing courses. This study examined the impact of embedding discipline-specific data science modules into undergraduate STEM courses at three universities in the United States, using a collaborative research-practice approach. Researchers analyzed survey responses from 877 students, instructor grades, and interviews across six courses to understand changes in student perceptions of data science across different demographics, academic levels, and disciplines, as well as how students’ self-assessments compared with instructor evaluations.
The results showed that students’ confidence and perception of their data science abilities improved significantly after completing one or more modules, regardless of the course or university. Student self-assessments closely matched instructor evaluations, indicating consistent recognition of skill development. Students reported benefits such as connecting data science to real-world applications and career relevance, though they also noted challenges with learning new data analysis tools and navigating varying prior experience levels. These findings provide valuable guidance for educators seeking to integrate data science into STEM curricula in ways that are meaningful, engaging, and practical.
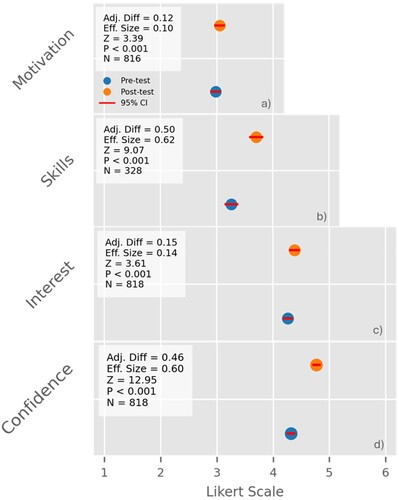
Figure 1. Results of the mixed-effects models indicating the effect of taking one or more modules on constructs. Adj. Diff indicates the adjusted difference (i.e. difference after controlling for course and institutions) between pre- and post-survey scores, Eff. Size the effect size calculated using Westfall, Kenny, and Judd (Citation2014) method, Z the test statistic, P the p-value, and N the sample size. Blue and orange dots represent pre- and post-survey mean adjusted scores, respectively, with horizontal red lines indicating 95% confidence intervals.