Jiang, X., Washington, M. K., Izzy, M. J., Piantek, G., Lu, M., Yan, X., Gore, J. C., & Xu, J. (2025). Noninvasive assessment of liver inflammation in metabolic dysfunction associated steatohepatitis using MR cytometry. NPJ Imaging, 3(1), 17. https://doi.org/10.1038/s44303-025-00080-4
Diagnosing metabolic dysfunction-associated steatohepatitis (MASH) currently relies on a liver biopsy, an invasive procedure used to assess fat buildup (steatosis), inflammation, and damaged liver cells (ballooning). Although MRI techniques such as proton density fat fraction (PDFF) and MR elastography can non-invasively measure liver fat and scarring (fibrosis), there are still no reliable imaging methods to directly evaluate liver inflammation without a biopsy.
In this study, we developed a new diffusion MRI (dMRI)–based approach called MR cytometry to non-invasively map basic cellular features of the liver. This technique estimates MRI-derived cell size (excluding fat) and cell density, which reflect underlying tissue microstructure. We first validated the method using simulations guided by histology and by imaging fixed human liver samples outside the body. These tests showed that stromal regions of the liver have smaller apparent cell sizes and higher cell densities compared with normal liver tissue and fat-rich tissue.
We then tested the feasibility of MR cytometry in living people using a standard clinical 3-tesla MRI scanner, scanning both healthy volunteers and patients with MASH. The results demonstrate that MR cytometry can detect differences in liver microstructure associated with disease, suggesting that this approach may provide a promising non-invasive way to characterize liver inflammation and related cellular changes in MASH.
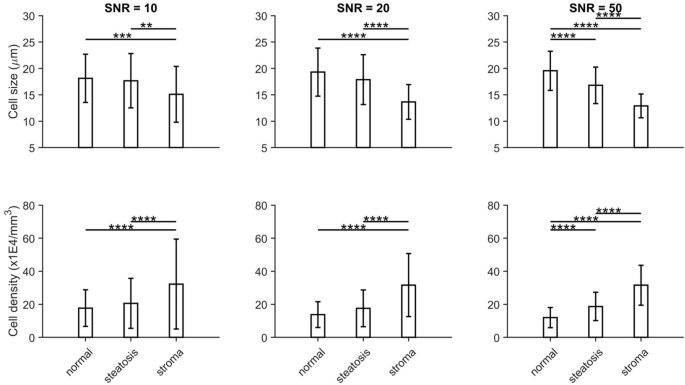
Fig. 1: Comparison of MRI-Derived cellular properties from Histology-Based Simulations Across Tissue Types and SNR Levels.
Fitted cell sizes (top row) and densities (bottom row) from histology-based simulated diffusion signals for normal liver tissues, steatosis, and stroma (a combination of inflammatory cells and fibrosis) at three different SNR levels (10, 20, and 50, from left to right). *P < 0.05, **P < 0.01, ***P < 0.001, and ****P < 0.0001 as measured by one-way analysis of variance (ANOVA) with Bonferroni correction.