Chen, Jingyuan E., Lewis, Laura D., Coursey, Sean E., Catana, Ciprian., Polimeni, Jonathan R., Fan, Jiawen., Droppa, Kyle S., Patel, Rudra., Wey, Hsiaoying., Chang, Catie E., Manoach, Dara S., Price, Julie C., Sander, Christin Y.M., & Rosen, Bruce Robert. (2025). Simultaneous EEG-PET-MRI identifies temporally coupled and spatially structured brain dynamics across wakefulness and NREM sleep. Nature Communications, 16(1), 8887. https://doi.org/10.1038/s41467-025-64414-x
Sleep causes major shifts in how the brain uses energy and how blood flow changes, but the detailed timing and patterns of these processes are still not fully understood. In this study, researchers combined functional PET, EEG, and fMRI—three powerful brain-imaging tools collected at the same time—to track how metabolism and blood flow change as people transition from wakefulness into non-rapid eye movement (NREM) sleep.
They found that as the brain moves into NREM sleep, global glucose metabolism steadily decreases, and at the same time, large hemodynamic (blood-flow–related) fluctuations begin to appear. Both of these changes closely follow shifts in EEG arousal levels, showing how tightly linked these processes are during the onset of sleep.
The study also identified two distinct brain network patterns unique to NREM sleep:
- Aslow (~0.02 Hz), oscillating sensorimotor network that stays metabolically active and dynamic, meaning sensory and motor areas continue to respond even during sleep.
- Adefault-mode network (DMN) that shows reduced hemodynamic and metabolic activity, reflecting the decreased self-awareness and internal thought typical of sleep.
These findings help explain why we lose conscious awareness during sleep but can still respond to certain sensory signals. They also highlight the complex and alternating balance of neuronal, blood-flow, and metabolic activity that shapes brain function during sleep.
Finally, this work shows how combining EEG, PET, and MRI can offer powerful new insights into the biological mechanisms behind cognition, arousal, and sleep in humans.
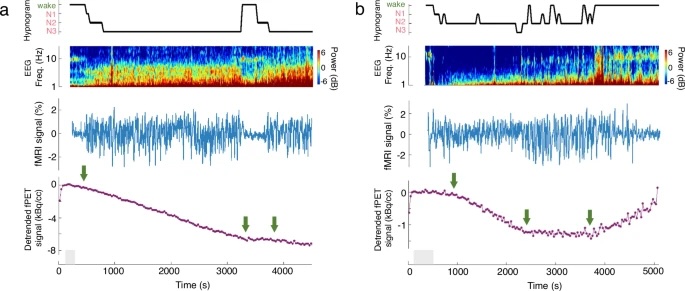
Fig. 1: Trimodal imaging of the electrophysiological, BOLD-fMRI, and fPET-FDG metabolic dynamics accompanying arousal-state transitions.
Study protocol for the design, implementation, and evaluation of the STRATIFY clinical decision support tool for emergency department disposition of patients with heart failure
a, b Top: Hypnogram of scored sleep staging and the spectrogram of an occipital EEG electrode; middle: fMRI-based hemodynamic oscillations of the visual network; bottom: fPET-based metabolic dynamics of the default-mode network. Networks were extracted using a public functional atlas59. Functional PET signals were temporally detrended according to the arbitrarily chosen initial wakeful period (i.e., removal of the linear trend fitted to the data points within the shaded gray area) only in this plot to help visualize altered slopes at state transitions, with an increase/decrease of TAC slope indicating increased/decreased metabolism. Changes in electrophysiological recordings, fMRI intensities, and glucose metabolism (highlighted with green arrows) were identifiable across sleep-wake cycles (a, subject i) and within the NREM sleep (b, subject ii), mirroring arousal-state transitions (top, inferred from simultaneous EEG recordings). Note that our goal here is to highlight arousal-induced changes in the imaging signals, so we show fMRI and fPET signals from exemplar networks that exhibit strong sleep-wake differences for each modality independently (see group-level results in Fig. 3 below; to avoid a circular analysis, we re-ran the group-level analysis without including the two illustrative subjects shown here, the findings remained unaltered).