Zhu, Junda., Garin, Clément M., Qi, Xuelian., Machado, Anna., Wang, Zhengyang., Ben-Hamed, Suliann B., Stanford, Terrence R., Salinas, Emilio., Whitlow, Christopher T., Anderson, Adam W., Zhou, Xin Maizie., Calabro, Finnegan J., Luna, Beatriz., & Constantinidis, Christos. (2025). Longitudinal measures of monkey brain structure and activity through adolescence predict cognitive maturation. Nature Neuroscience, 28(11), 2344-2355. https://doi.org/10.1038/s41593-025-02076-0
In humans and other primates, the adolescent years are a time when thinking and problem-solving abilities improve, and the brain continues to grow and reorganize. However, scientists still don’t fully understand how these structural brain changes influence the actual neural activity that supports cognitive performance. In this study, researchers followed monkeys throughout adolescence and measured their behavior, their neurons’ activity, and their brain structure over time to better understand this process.
The team focused on the prefrontal cortex, a brain region important for working memory—the ability to hold and use information for short periods. They found that changes in prefrontal neural activity closely matched the animals’ improvements in working memory skills. More complex patterns of neural activity evolved gradually through the teenage years, but even simple features—like the average firing rate of neurons and how much that activity varied—helped predict how well the animals performed.
The researchers also examined how changes in the brain’s wiring related to these improvements. They discovered that the development of long-distance white matter tracts—pathways that connect the frontal lobe to other brain regions—strongly predicted both the progression of neural activity and gains in cognitive performance. Surprisingly, changes in brain volume and cortical thickness, which are known to shift during human adolescence, did not predict these neural or behavioral changes in monkeys.
Overall, the study shows that the maturation of white matter connections plays a key role in shaping how neural activity develops during adolescence, helping to support the rise in cognitive abilities during this critical period.
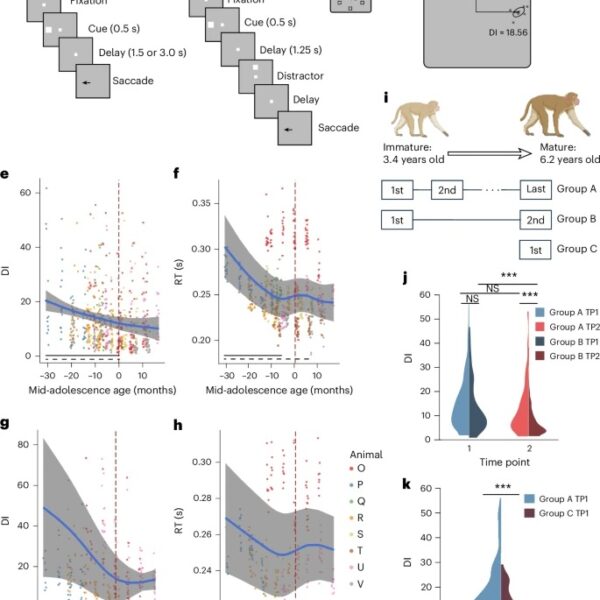
Fig. 1: Saccade precision and latency improve during adolescence.
a, Sequence of events in the ODR task. The monkey is required to maintain fixation while a cue stimulus is presented and after a delay period, when the fixation point turns off, saccade to the remembered location of the cue. b, Sequence of events in the ODR with distractor task. After the delay period, a distractor stimulus appears, which needs to be ignored. The monkey is still required to saccade to the remembered location of the cue. c, Possible locations of the stimulus presentation on the screen. d, Schematic illustration of variability of two groups of saccades. The gray dots represent the endpoints of individual saccades for two stimulus locations. DI, defined as the area within one s.d. from the average landing position of each target is shown. e, DI in the ODR task, during the neural recording sessions. Each dot is one session; data from different monkeys are shown in different colors. The blue line shows the GAMM-fitted trajectory. The gray shaded regions denote the 95% confidence intervals (CIs). The dashed vertical line denotes a mid-adolescence age of 0. The horizontal dashed bar denotes significant developmental effect intervals. The horizontal solid bar denotes intervals with significant monotonic developmental effect. f, As in e, for the RT of saccade in the ODR task. g, As in e, for the DI in the ODR with distractor task. h, As in f, for the RT in the ODR with distractor task. i, Schematic diagram of the three cohorts of monkeys (groups A–C) used to evaluate behavioral improvement. The image of the monkeys was created with BioRender. j, DI in the ODR task of groups A and B at the TP1 and TP2 time points. The violin plot shows the distribution of DI values for both groups at two distinct time points, with the width of the plot indicating the density of the data points. Statistical comparisons were performed with a two-sided, two-sample t-test (no adjustment for multiple comparisons). TP1: P = 0.21; TP2: P = 2.83 × 10⁻⁴. k, DI in the ODR task of groups A and C at the first time point. Two-sided, two-sample t-test (no adjustment for multiple comparisons): P = 9.35 × 10⁻⁵. ***P < 0.0001.