Soleimani-Meigooni, David N.; Pezzoli, Stefania; Blazhenets, Ganna; la Joie, Renaud; Lin, Zoe; Soppe, Carol L.; Johnson, Derek Richard; Koran, Mary Ellen Irene; McConathy, Jonathan E.; Nasrallah, Ilya M.; Ponisio, Maria Rosana; Tanner, Jeremy A.; Villemagne, Victor Luis; Windon, Charles Christian; Zeineh, Michael Maroun; Biber, Sarah A.; Kukull, Walter A.; O’Connell, Heather; Peterson, Daniel J.; Mormino, Elizabeth C.; Johnson, Sterling C.; Rabinovici, Gil Dan. (2025). Calibration of multisite raters for prospective visual reads of amyloid PET scans. Alzheimer’s and Dementia, 21(10), e70732. https://doi.org/10.1002/alz.70732
In large, multi-site Alzheimer’s disease studies, brain scans known as amyloid positron emission tomography (PET) are usually interpreted by a small group of central experts. However, expanding the number of trained readers across research centers could make this process more scalable and improve how well the results apply across different hospitals and imaging systems. In this study, ten neuroimaging experts from eight Alzheimer’s Disease Research Centers (ADRCs) reviewed 180 amyloid PET scans. The scans included four different amyloid tracers and were collected from a wide range of imaging systems. Each expert analyzed 30 scans and 15 duplicate scans using their preferred viewing software, without the use of anatomical images or automated quantitative tools. Scans were classified as either elevated or non-elevated in amyloid according to tracer-specific reading criteria. The level of agreement between readers (inter-rater agreement) and within each reader’s repeated assessments (intra-rater agreement) was then evaluated.
The study found substantial agreement among experts, with a Fleiss’ κ of 0.78, and complete consensus on 69% of scans. Reliability across the four amyloid tracers ranged from substantial to perfect (Fleiss’ κ = 0.70–0.87), while intra-rater consistency ranged from 0.79 to 1.0 (Cohen’s κ), indicating that readers were highly consistent with themselves. Agreement was lower for scans showing intermediate amyloid levels, corresponding to 10–40 Centiloids, a range that is more difficult to interpret.
Overall, the findings demonstrate that a distributed network of experts across multiple centers can reliably classify amyloid PET scans, even when using different tracers and reading software. The set of scans used in this project will serve as a valuable reference for reader training and quality assurance in future multicenter Alzheimer’s disease studies.
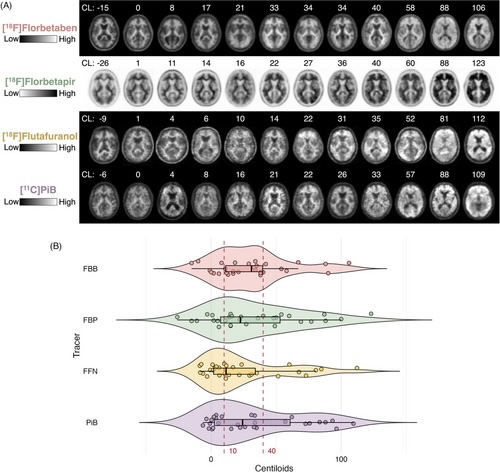
FIGURE 1
Amyloid PET scans examples and Centiloid distribution. A, Examples of amyloid PET scans for each radiotracer that span the Centiloid continuum. B, Centiloid distribution of amyloid PET scans by tracer. Red dotted lines represent the boundaries of the 10–40 Centiloid intermediate range. FBB, [18F]florbetaben; FBP, [18F]florbetapir; FFN, [18F]flutafuranol; PET, positron emission tomography; PIB, [11C]Pittsburgh compound B.