Harmych, Sarah J., Hasaka, Thomas P., Sievers, Chelsie K., Kang, Seung-woo, Ramirez, Marisol Adelina, Jones, Vivian Truong, Zhao, Zhiguo, Kovtun, Oleg, Wahoski, Claudia C., & Liu, Qi. (2025). 3D collagen high-throughput screen identifies drugs that induce epithelial polarity and enhance chemotherapy response in colorectal cancer. Communications Biology, 8(1), 1261. https://doi.org/10.1038/s42003-025-08699-0
One of the hallmarks of cancer is the loss of cell polarity—the way cells normally organize themselves. In colorectal cancer (CRC), this loss is tied to a process called epithelial-to-mesenchymal transition (EMT), which affects how aggressive the cancer is and how well treatments work. But the mechanisms behind these EMT-related changes, and the drugs that might reverse them, are not well studied. This is partly because traditional lab tests either cannot capture changes in cell shape (in 2D cultures) or are not reliable enough in 3D cultures.
To address this, we created a high-throughput screening method using 3D collagen cultures of CRC cells to study changes in colony shape. With this approach, we identified several FDA-approved drugs that helped CRC cells regain more normal, epithelial-like features. One of these drugs, azithromycin, made the cancer cell colonies rounder, improved the placement of key proteins (E-cadherin and ZO-1) that keep cells connected, triggered gene expression changes consistent with reversing EMT, and made the cancer cells more sensitive to the chemotherapy drug irinotecan.
Looking at patient data, we also found that CRC patients who received azithromycin while being treated with irinotecan had better 5-year survival rates compared to those who received chemotherapy alone. These findings show the value of studying cancer cell shape in 3D screens and point to new possibilities for drug repurposing and combination therapies in colorectal cancer.
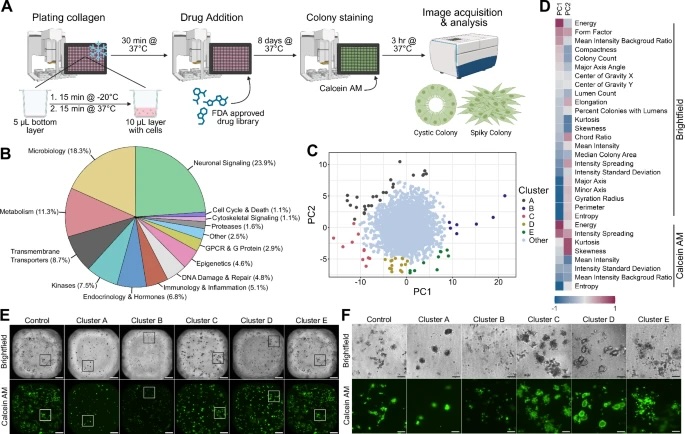
Fig. 1: High-throughput drug screen using 3D type I collagen cultures identifies morphological clusters.
A Schematic of plating, treatment, and analysis of drug screen. Chilled 384-well plates were stamped with a 5 µL bottom layer of type I collagen and allowed to solidify. 1000 SC cells in 10 µL collagen were then added and allowed to solidify. Next, 1059 compounds from an FDA-approved drug library were added at three concentrations and incubated for 8 days. Wells were then stained with Calcein AM, imaged, and analyzed to assess colony morphology. Created in BioRender. (Harmych, S. (2025) https://BioRender.com/4zfblch). B Pie graph depicting functional targets of drugs tested during screen. C Principal component analysis (PCA) plot of morphological characteristics of colonies from high-throughput drug screen. Morphological characteristics were obtained using the InCarta software. Each dot represents a compound-treated well from the screen. Distinct Clusters (A−E) separating from the central cluster were visually assessed and shown on the PCA plot. D Heatmap of PC loadings of each variable on PC1 and PC2. Brightfield and Calcein AM indicate which image was used by InCarta software to generate the value. E Representative whole well images of morphological clusters identified in the screen. Boxes correspond to images shared in Fig. 1F. Brightfield and fluorescent (Calcein AM) images taken with ImageXpress confocal HT.ai automated high-content imaging system at 4x magnification. (Scale bars: 500 µm). F Insets of representative wells shown in Fig. 1E. (Scale bars: 100 µm).