Witt, Atlee A., Combes, Anna J.E., Sengupta, Anirban, Zhang, Xinyu, Stubblefield, Seth, McKnight, Colin David, McGonigle, Trey William, McGrath, Megan, Stewart, Isabella, & Sweeney, Grace. (2025). “Changes in functional connectivity in relapsing-remitting multiple sclerosis spinal cord measured via region-based and data-driven analyses.” Imaging Neuroscience, 3, IMAG.a.51. https://doi.org/10.1162/IMAG.a.51
In multiple sclerosis (MS), a disease where the protective covering of nerve fibers is damaged, the symptoms people experience often do not match what standard MRI scans show. Functional MRI (fMRI) can help us understand how the brain and spinal cord’s networks adapt to this structural damage. While fMRI studies in the brain are common, studying the spinal cord is more difficult due to its small size and interference from normal body movements.
In this study, we used resting-state fMRI at 3T to examine the spinal cord of healthy people and those with relapsing-remitting MS. We looked at functional connectivity, which measures how different regions of the spinal cord communicate, and related these findings to clinical measures of disability.
We found that the strongest connectivity occurs between the ventral gray matter regions in both healthy participants and people with MS. Reduced connectivity was linked to poorer mobility. Using a data-driven analysis, we also observed a possible compensatory increase in connectivity in earlier stages of MS compared with later stages.
These results suggest that MS affects how the spinal cord functions and that the nervous system may try to compensate for early damage. Further research is needed, but our findings support the idea that functional changes in the spinal cord are an important part of MS.
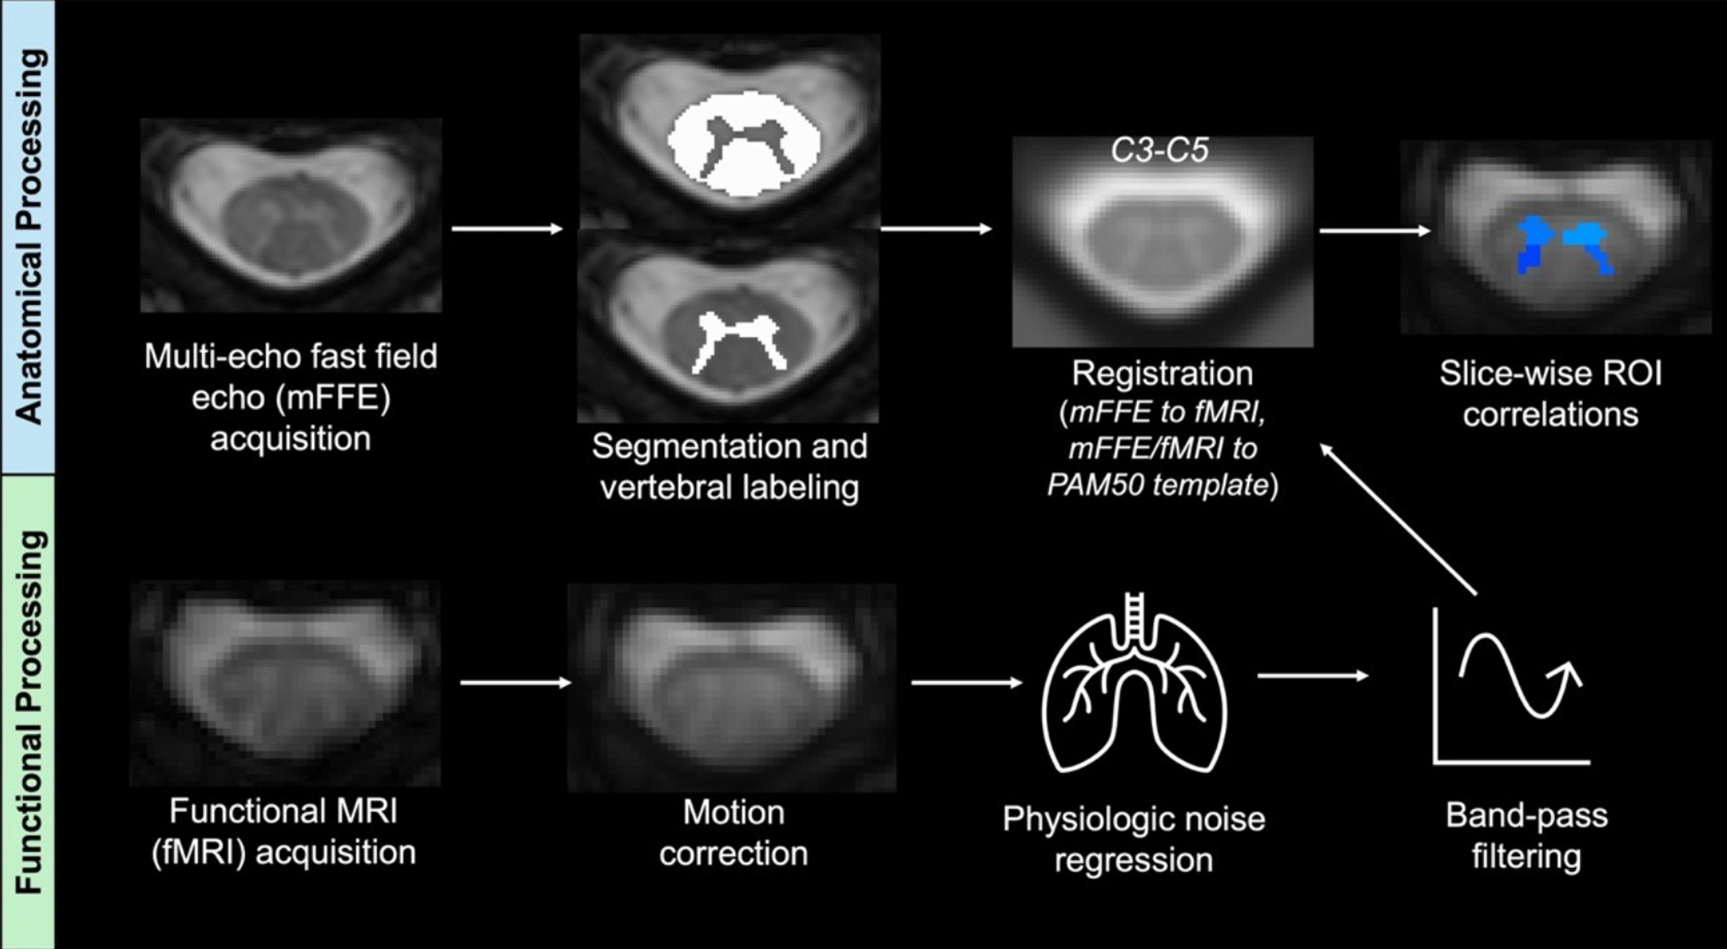
Fig.1. Anatomic and functional data processing pipelines. For the anatomic image, vertebral levels were identified on the sagittal T2w image before co-registration of the T2w and multi-echo fast field echo (mFFE) image. For the functional image (fMRI), motion correction was followed by physiologic noise regression using AFNI-RETROICOR and band-pass filtering via a Chebyshev Type II filter. The resulting denoised fMRI and mFFE images were co-registered to one another, and then to the PAM50 template between spinal levels C3 and C5. The gray matter (GM) horns applied on top of the final functional image were extracted from the mFFE image in functional space. ROI correlations were identified between each horn, per slice.