Nolan, Emma, Sun, Yunyi, Shi, Hui, Archer, Derek, Perry, Arden, Pechman, Kimberly, Shashikumar, Niranjana, Landman, Bennett, Gogniat, Marissa, Liu, Dandan, Zhang, Panpan, Hohman, Timothy J., Jefferson, Angela L., & Full, Kelsie M. (2025). The association between poor sleep health and Alzheimer’s disease structural neuroimaging biomarkers. *Alzheimer’s and Dementia, 21*(6), e70364. https://doi.org/10.1002/alz.70364
Poor sleep may increase the risk of brain degeneration and Alzheimer’s disease (AD), but few studies have looked at how sleep patterns relate to actual brain structure.
In this study, 407 adults with a median age of 70 from the Vanderbilt Memory and Aging Project wore wrist devices (ActiGraphs) for 10 days to measure their sleep habits—including how regular their sleep was, how long they slept, how often they woke up, and how long they stayed awake during the night. Brain scans (3T MRI) were then used to measure the size (volume) of specific brain regions that are known to be affected in Alzheimer’s disease. Researchers used statistical models to adjust for other factors like age, lifestyle, mood, thinking ability, and heart health.
The results showed that people with more irregular sleep schedules and longer periods of wakefulness during the night had smaller brain volumes in regions that are vulnerable to Alzheimer’s disease—such as the hippocampus and parietal lobe.
This suggests that poor or disrupted sleep might be linked to early brain changes seen in Alzheimer’s disease.
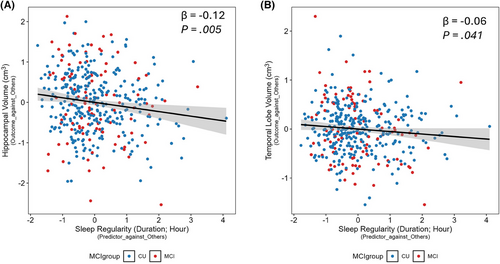
Figure 1
Relationship between baseline sleep irregularity and ROI volumes. A, Partial regression plot of Model 2 showing the association of baseline sleep irregularity and baseline hippocampus volume (cm3). The β is the effect estimate. The p value of 0.005 indicates that higher sleep irregularity is associated with smaller hippocampal volumes. B, Partial regression plot of Model 2 showing the association of baseline sleep irregularity and baseline temporal lobe volume (cm3). The β is the effect estimate. The p value of 0.041 indicates that higher sleep irregularity is associated with smaller temporal lobe volumes. Associations are adjusted for age, sex, race, education, APOE ɛ4, FSRP, BMI, sleep medication use, and mean cortical thickness. Individuals who are CU are shown in blue, and individuals who have MCI are shown in red. The black line represents the fitted regression line, and the shaded area indicates the 95% confidence interval. APOE, apolipoprotein E; BMI, body mass index; CU, cognitively unimpaired; FSRP, Framingham Stroke Risk Profile; MCI, mild cognitive impairment; ROI, region of interest.