Clements, Rebecca G., Zvolanek, Kristina M., Reddy, Neha A., Hemmerling, Kimberly J., Bayrak, Roza G., Chang, Catie, & Bright, Molly G. (2025). Quantitative mapping of cerebrovascular reactivity amplitude and delay with breath-hold BOLD fMRI when end-tidal CO2 quality is low. *Imaging Neuroscience, 3*, imag_a_00536. https://doi.org/10.1162/imag_a_00536
Cerebrovascular reactivity (CVR) refers to how well blood vessels in the brain can expand or contract in response to changes in carbon dioxide (CO₂) levels. This is an important way to measure brain blood vessel health. CVR is often measured during a functional MRI (fMRI) scan using a breath-hold task, which temporarily increases CO₂ levels in the blood. To calculate CVR accurately, scientists typically measure the amount of CO₂ in the air a person exhales—called end-tidal CO₂ (PETCO₂)—using a small tube placed under the nose. This helps calculate two important measurements: how strong the blood vessel response is (CVR amplitude, in standard units like %BOLD/mmHg) and how long the response takes (CVR delay, in seconds). Using standard units makes it easier to compare results across people and across different scan sessions.
Although most people, including patients, can successfully perform the breath-hold task, accurately measuring PETCO₂ requires participants to follow specific breathing instructions—such as only breathing through the nose and exhaling at the right moments. Even healthy participants often struggle with this, which has made it harder to use this method in real clinical settings.
To work around this issue, researchers have used another measure called respiration volume per time (RVT), which is calculated from a belt worn around the chest. RVT is easier to collect because it doesn’t rely on extra breathing instructions, but it doesn’t produce CVR measurements in standard units like PETCO₂ does.
In this study, researchers explored two ways to improve CVR measurements when PETCO₂ data quality is low. First, they tested whether RVT could be adjusted (or “rescaled”) using high-quality PETCO₂ data to create CVR measurements in standard units. Second, they used deep learning to predict PETCO₂ values from RVT and then used those predicted values to create more accurate CVR maps.
Using detailed breath-hold fMRI data, both approaches—rescaled RVT and predicted PETCO₂—produced results that closely matched the gold-standard CVR measurements. The predicted PETCO₂ approach gave the most accurate results. In one patient with Moyamoya disease, which affects brain blood flow, the predicted PETCO₂ method was better at detecting abnormal brain regions than RVT alone.
Overall, this work helps make CVR testing more practical in real-world clinical settings, especially for people who may have difficulty following complex breathing instructions.
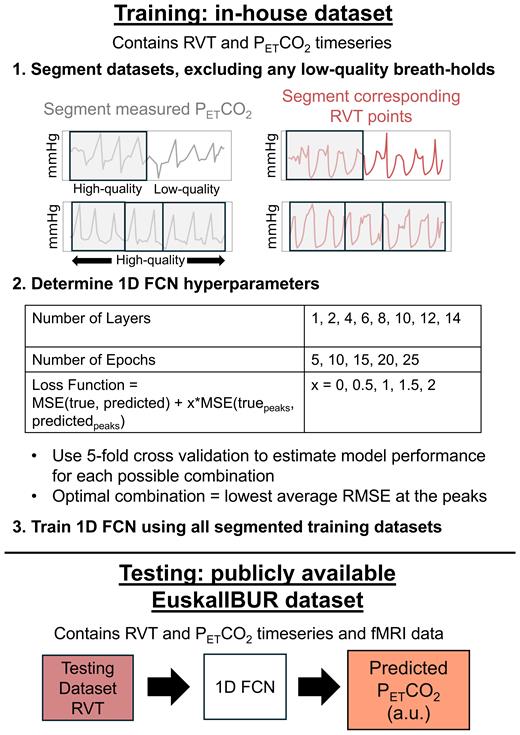
Fig 1
Overview of the methods for training and evaluating a 1D FCN to predict PETCO2 from RVT. Training datasets were randomly separated into 1–4 smaller data segments, excluding any low-quality breath holds. Optimal hyperparameters were identified by using 5-fold cross-validation to estimate model performance for each possible combination, and the model was trained using the optimal hyperparameter combination. Next, the RVT timeseries in the test dataset, along with subject ID (not shown in the figure), were inputted to the model to generate PETCO2predictions in arbitrary units (a.u.).