Li, Muwei, Xu, Lyuan, Choi, Soyoung, Qin, Yuanyuan, Gao, Fei, Schilling, Kurt G., Gao, Yurui, Zu, Zhongliang, Anderson, Adam W., Ding, Zhaohua, & Gore, John C. (2025). Functional contrast across the gray-white matter boundary. *Nature Communications, 16*(1), 6077. https://doi.org/10.1038/s41467-025-61251-w
Most brain imaging studies have focused on gray matter—the part of the brain that processes information—while paying less attention to white matter, which connects different brain regions. This study looks at how gray and white matter work together by introducing two new measurements. The first, called gray-white matter functional connectivity, tracks how closely the activity in gray and white matter is timed together. The second, called the gray-white blood oxygenation-level dependent (BOLD) power ratio, compares how strong the brain signals are in gray matter versus white matter.
The study found that gray-white matter functional connectivity follows patterns related to how the brain is wired and organized, especially in areas that control movement and basic senses—suggesting that signals move efficiently between gray and white matter. On the other hand, the power ratio showed the opposite pattern, with higher values in brain regions involved in more complex thinking, which may mean that those areas require more energy. The power ratio also increased with age, from 8 to 21 years old, suggesting that as the brain develops, its energy needs shift.
Together, these two measurements show how gray and white matter work together differently—one focused on signal clarity, the other on energy use—helping us better understand brain development and communication.
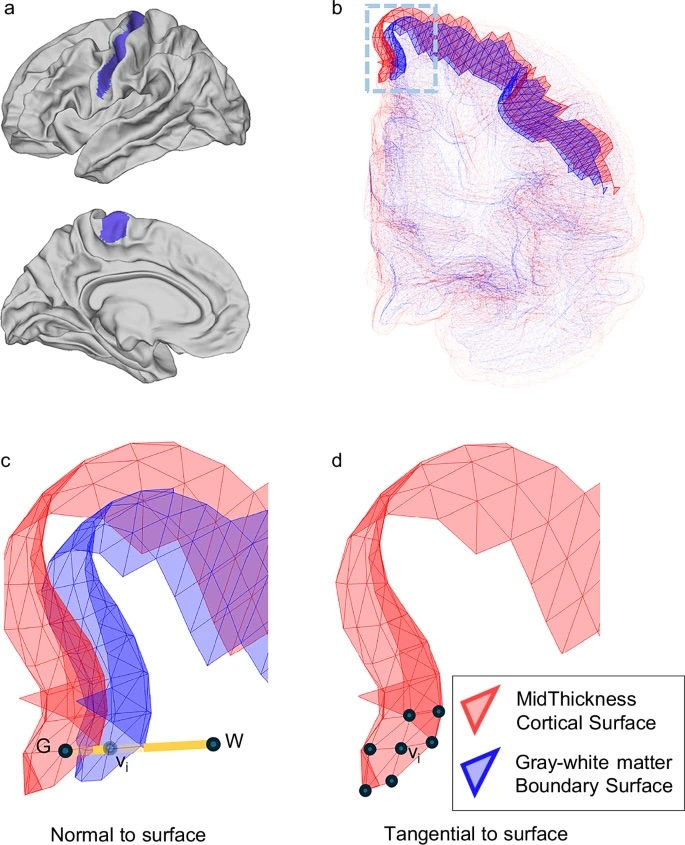
Fig. 1: Overview of functional contrast across the gray-white matter boundary.
a The white matter surfaces are shown from a lateral view, highlighting the primary motor cortex in blue. b Mesh surface of mid-thickness cortex (red) and gray-white matter boundary (blue). c Schematic of functional contrast measures normal to the surface. For a given vertex vion the boundary surface, its corresponding GM vertex (G) and WM point (W) are identified along the line perpendicular to the surface. d Schematic of functional connectivity measures tangential to the surface. ReHo is calculated for each vertex vi on the mid-thickness surface by measuring the correlation of BOLD signals among neighboring vertices, which are connected along the tangential direction to the surface. ReHo regional homogeneity.