Gao, Chenyu, Kim, Michael E., Ramadass, Karthik, Kanakaraj, Praitayini, Krishnan, Aravind R., Saunders, Adam M., Newlin, Nancy R., Lee, Ho Hin, Yang, Qi, Taylor, Warren D., Boyd, Brian D., Beason-Held, Lori L., Resnick, Susan M., Barnes, Lisa L., Bennett, David A., Albert, Marilyn S., Van Schaik, Katherine D., Archer, Derek B., Hohman, Timothy J., Jefferson, Angela L., Išgum, Ivana, Moyer, Daniel, Huo, Yuankai, Schilling, Kurt G., Zuo, Lianrui, Bao, Shunxing, Mohd Khairi, Nazirah, Li, Zhiyuan, & Davatzikos, Christos. (2025). Brain age identification from diffusion MRI synergistically predicts neurodegenerative disease. *Imaging Neuroscience, 3*, imag_a_00552. https://doi.org/10.1162/imag_a_00552
Brain scans can be used to estimate a person’s “brain age,” which may be older or younger than their actual age. A larger difference between brain age and actual age can provide early warning signs of neurodegenerative diseases like Alzheimer’s, potentially allowing for earlier diagnosis and prevention. One type of brain scan, called diffusion MRI (dMRI), is especially useful for this because it can detect very subtle changes in the brain’s structure that may happen before more obvious signs appear. However, dMRI captures both large-scale (macrostructural) and small-scale (microstructural) features of the brain, and it’s unclear whether current models for estimating brain age from dMRI are focusing on the small-scale changes that matter most for early detection.
To better isolate the microstructural information, this study developed a new approach that reduces the influence of macrostructural features by aligning all brain scans to a common reference template. The method was tested using imaging data from 13,398 people across 12 different datasets. The researchers compared this new microstructure-focused dMRI brain age model to several other models based on T1-weighted MRI, a common type of scan that primarily captures macrostructural features.
They found that the dMRI-based brain age and T1-based brain age showed different patterns depending on the stage of disease. For people who were transitioning from normal cognitive function to mild cognitive impairment (MCI), the dMRI brain age appeared older than the T1-based brain age. In contrast, for those already diagnosed with Alzheimer’s disease, the dMRI brain age appeared younger. Models based on T1-weighted MRI generally performed better at identifying who had Alzheimer’s, but the dMRI-based brain age may be more helpful in identifying early, subtle changes that happen before symptoms begin.
Fig 1
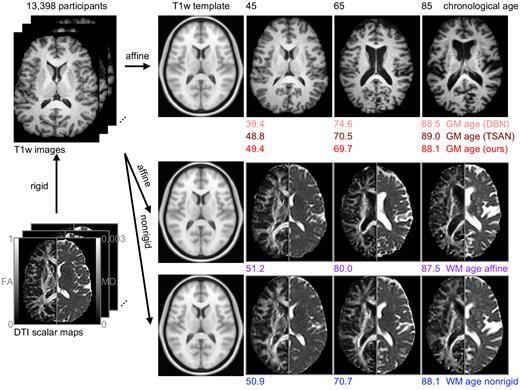
Brain age estimation frameworks have proven effective for using affinely aligned brain images to identify common patterns of aging, with deviations from these patterns likely indicating presence of abnormal neuropathologic processes. A common theme of existing brain age estimation methods has been using T1w MRI, denoted as “GM age” in the first row. Among them, there have been many innovations in network design, such as DeepBrainNet (DBN) (Bashyam et al., 2020) and the 3D convolutional neural network of TSAN (Cheng et al., 2021). T1w MRI lacks detail in white matter (WM). Here, we take the two most commonly used modalities for characterizing WM microstructure, fractional anisotropy (FA), and mean diffusivity (MD), and we evaluate brain age estimation in two contexts. First, we examine the direct substitution of FA and MD for T1w image, which we denote as “WM age affine” in the second row. A substantial amount of macrostructural differences is still present in WM age affine, notably ventricle enlargement. To isolate the microstructural changes, we apply non-rigid (deformable) registration into template space to mitigate the macrostructural changes and produce the “WM age nonrigid” in the third row. We explore the relative timing of changes in these brain age variants and their relative explainability in the context of mild cognitive impairment. Throughout the paper, we adhere to a consistent color scheme when visualizing results from different brain age estimates within the same plot to facilitate easier visual inspection. Specifically, we use red to represent GM ages, blue for WM age nonrigid, and purple for WM age affine.