Lasko, Thomas A.; Stead, William W.; Still, John M.; Li, Thomas Z.; Kammer, Michael; Barbero-Mota, Marco; Strobl, Eric V.; Landman, Bennett A.; Maldonado, Fabien. “Unsupervised Discovery of Clinical Disease Signatures Using Probabilistic Independence.” Journal of Biomedical Informatics 166 (2025): 104837. https://doi.org/10.1016/j.jbi.2025.104837.
This study uses a method based on probabilistic independence to help uncover the hidden, patient-specific causes—or “sources”—of disease using data from electronic health records (EHRs). In this approach, each disease source is treated as an unobserved root cause in a network that influences various observed medical variables like lab tests, medications, billing codes, and demographics. The effects of each source—its signature—are the patterns these causes leave behind in the data.
By analyzing a large dataset of over 269,000 patient records and 9,195 variables, the model was able to infer 2,000 potential disease sources and their unique signatures. To test the method, the researchers used it to explore the causes of benign vs. malignant pulmonary nodules (small spots in the lungs) in more than 13,000 cases. The model successfully identified 92% of known malignant causes and 30% of benign ones listed in an external reference. It also uncovered several likely causes not included in the reference list, but supported by other medical literature.
In many cases, the model could decompose a general diagnosis into more specific patterns related to disease progression or treatment. For example, a common malignant cause could be broken down into five or more detailed sub-patterns. Interestingly, the model also flagged many patients who may have had undiagnosed cancer, based on their data patterns.
These findings show that even from noisy, incomplete, and irregular health records, it’s possible to extract meaningful, patient-specific causes of disease. This could eventually help clinicians better understand complex cases and make more precise treatment decisions tailored to individual patients.
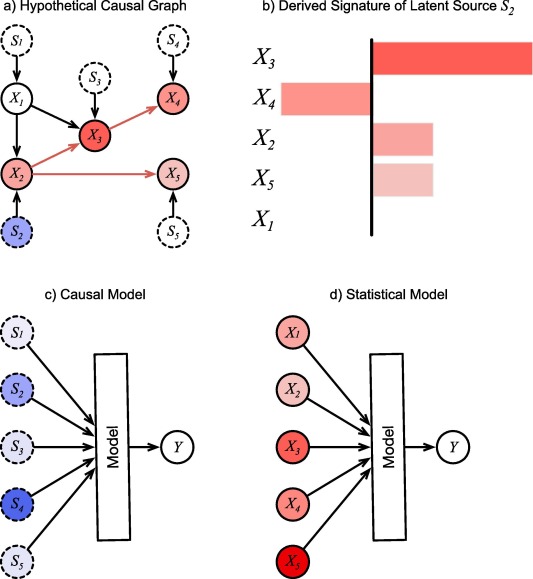
Fig. 1. A hypothetical causal graph and structured derived from it. a) The causal graph inferred from observing the (solid circles) over many records. The are inferred latent sources (dotted circles). Colors of the nodes indicate the degree to which a unit change in source affects them. They are arbitrary here for illustration, except for , which cannot be affected by . b) Causal effects of source collected into a bar-graph signature c) Causal model of using latent sources as inputs. d) Statistical model of using observations as inputs. Color intensity of inputs represent their hypothetical importance values for the prediction in a single instance. For the causal model, the inputs are mutually independent root nodes, and therefore can be interpreted as the causal sources of , which may suggest treatment approaches that address the specific causes for this patient, and which may be manipulated to investigate different counterfactual scenarios. For the statistical model, the importance values remain entangled and cannot be interpreted this way.