Bolt, Taylor; Wang, Shiyu; Nomi, Jason S.; Setton, Roni; Gold, Benjamin P.; deB.Frederick, Blaise; Yeo, B. T. Thomas; Chen, J. Jean; Picchioni, Dante; Duyn, Jeff H.; Spreng, R. Nathan; Keilholz, Shella D.; Uddin, Lucina Q.; Chang, Catie. “Autonomic Physiological Coupling of the Global fMRI Signal.” Nature Neuroscience (2025). https://doi.org/10.1038/s41593-025-01945-y.
The brain is highly sensitive to signals from the body’s internal environment, as shown by the many links between brain activity, blood flow (hemodynamics), and various physiological signals. In this study, researchers found that a major form of brain–body interaction can be described by a single spatiotemporal pattern—that is, a consistent pattern across space and time.
Using data from several independent groups and different types of functional MRI (fMRI) scans—including both single-echo and multi-echo sequences—they observed low-frequency cofluctuations (in the 0.01–0.1 Hz range) between global fMRI signals during rest, EEG (electroencephalogram) activity, and a wide range of peripheral autonomic signals. These included signals from the cardiovascular, respiratory, exocrine, and smooth muscle systems.
Interestingly, the same brain–body cofluctuations appeared not only at rest but also during cued deep breathing, in response to sensory stimuli, and during spontaneous EEG events in sleep. Even when researchers controlled for changes in end-tidal carbon dioxide (a measure of CO₂ in the lungs), the overall spatial pattern of global fMRI activity remained. This suggests that the source of these signals cannot be fully explained by breathing-related CO₂ changes alone.
These results indicate that the global fMRI signal reflects a key part of the brain’s arousal system, which is regulated by the autonomic nervous system—a system that helps manage vital functions like heart rate, breathing, and alertness.
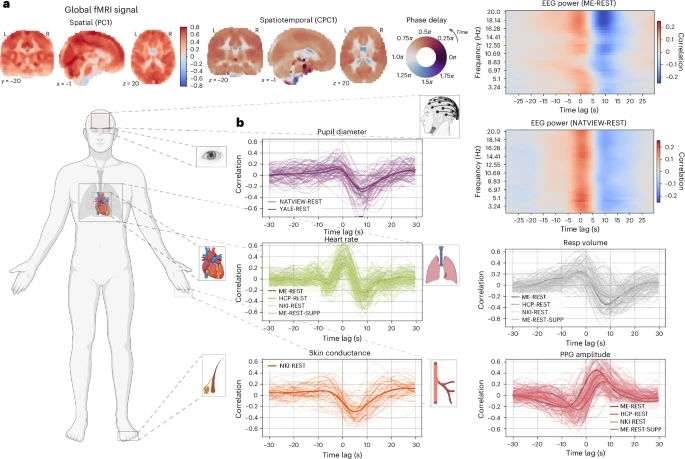
Fig. 1: Global fMRI fluctuations are associated with systemic physiological changes.
The cross-correlation between the time courses of the global fMRI signal (PC1) and multiple physiological signals. a, The spatial weights of the PC1 (left), and the phase delay map of the CPC1 (right) from the ME-REST dataset. The phase delay map of the CPC1 encodes the time delay (in radians) between voxels within the component. Because phase delay is measured in radians (0–2π), they are displayed with a circular color map. b, Cross-correlation plots of each physiological signal with the global fMRI time course (PC1). The cross-correlation is defined as the correlation coefficient between xt + i and yt, where t is the time index, i is ±30 s (that is, the index along the x axis of the plots) and x is the global fMRI signal and y is the physiological signal. Strong correlation at a positive time lag (that is, positive i index) indicates that the global fMRI signal lags or follows the physiological signal, while a strong correlation at a negative time lag (that is, negative i index) indicates that the global fMRI signal leads the physiological signal. Within a dataset, all participant-level cross-correlations are displayed in a lighter, more transparent color, while the mean cross-correlation across participants is displayed in a darker color. Each dataset is displayed in a separate shade of the same color. Cross-correlations between global fMRI signals and wavelet-filtered EEG power signals (Morlet wavelet; number of cycles = 15) for the ME-REST and NATVIEW-REST datasets are displayed as a heat map in the top right. The figure was created with BioRender.com.