
Data Playground
This Data Playground is a free and interactive data analysis tool. It is particularly useful for those individuals who do not have access to or skills to use advanced statistical software programs. Using this tool, you can conduct analyses of AmericasBarometer data, including tabulations of a single variable, cross-country comparisons on a map, and crosstabulations of two variables. For a comprehensive guide on how to use the Data Playground, see here (en español).
View the Visualization on Tableau
Frequently Asked Questions
- In the top menu bar, select a variable, country (countries), and year(s).
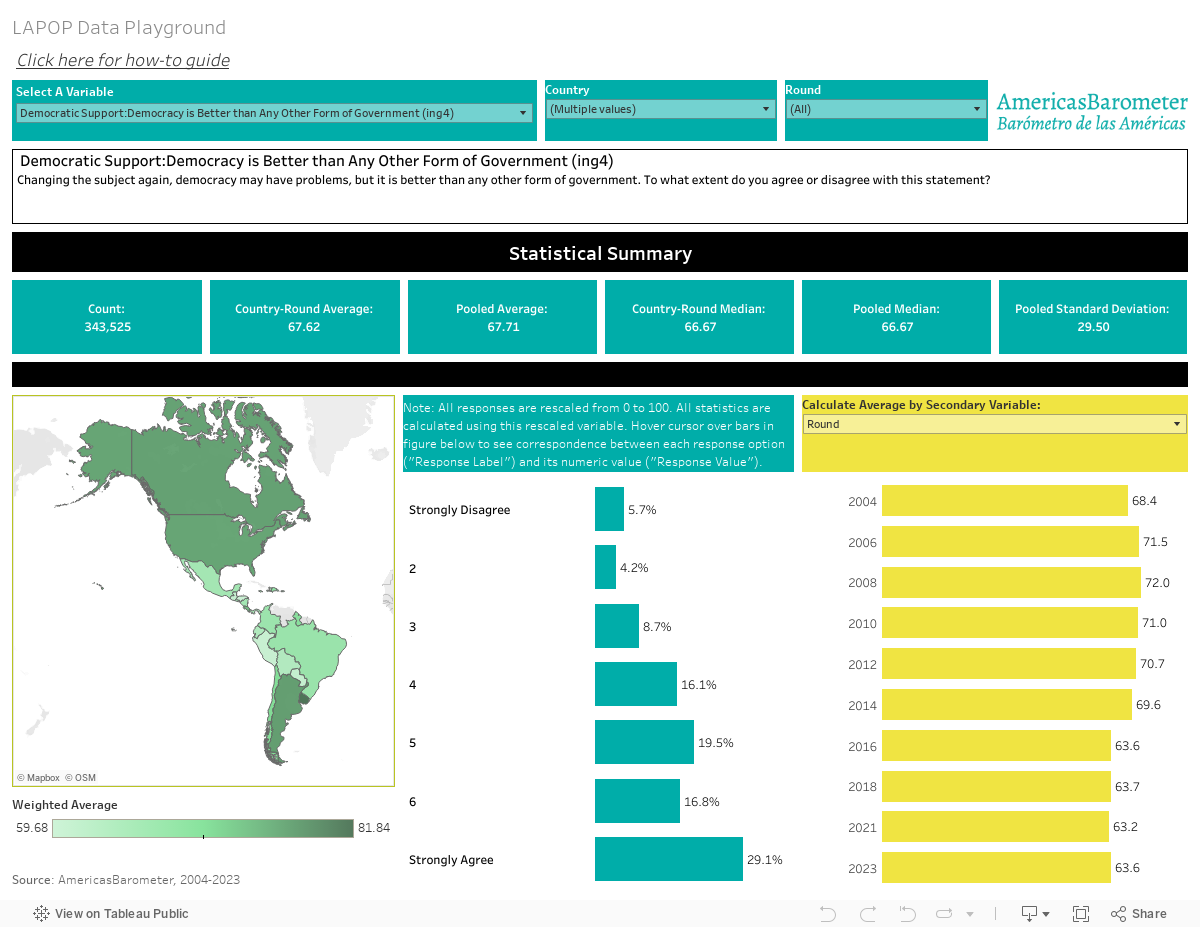
- The Playground will display the full question wording as well as the variable’s basic summary statistics, averages by country, and response distribution.
- In the yellow box in the lower-right pane, you can select a secondary variable to display a cross tabulation. The playground will show the average of the main variable for each category of the secondary variable.
All responses are coded with a numeric value between 0 and 100. Averages and other statistics like standard deviation and median are determined based on these numeric values.
For questions with only two responses choices, then, one choice (e.g. “No”) is given a value of 0 and the other (e.g. “Yes”) a value of 100. The average can be thought of as the percentage of respondents in the “100” category.
Questions with more response options are assigned numeric values and rescaled from 0 to 100. For example, ING4 (Democratic Support: Democracy is Better than Any Other Form of Government) has a seven-point agreement scale, from “Strongly disagree” (1), to the numbers 2 through 6, to “strongly agree” (7). These responses are recoded as 0, 16.667, 33.333, 50, 66.667, 83.333, and 100. The averages for these variables are not percentages, but the mean on this recoded scale.
Weighted. Responses are scaled so that each country-year has 1,500 respondents, ensuring cross-country and cross-time comparability. Some country-years also have poststratification weights to match the sample with population distributions on region, urban/rural residency, sex, age, education levels, and/or wealth.
We include only items that are part of the AmericasBarometer core questionnaire, i.e. those which are asked across most countries in most years.
Navigate to our data download site here.
The statistics you are looking for may have already been included in our statistical compendiums or numerous reports.
You may also click the download icon in the lower-right hand corner of the playground to download output and summary statistic data in the form of an image, Excel spreadsheet, CSV, PDF, PowerPoint slide, or Tableau Workbook.