
ASTR 1010: Introduction to Astronomy
 Christina Davis working with
David Weintraub, Professor of Physics and Astronomy
Overview
Question: Does using graphing software to create formulaic relations help students make predictions and identify assumptions in experiments?
Approach: To answer this question we have students recreate multiple astronomical expressions that led to the discovery of the expanding universe by fitting equations to historical data. During this process students will be asked to analyze assumptions made during the data collection that could bias the relationship that they found. They use the method of graphing and fitting data to find a measurement of the Hubble constant that agrees with our initial historical measurement. They then uncover assumptions that can be corrected to find an updated measurement that agrees with our current astronomical perspective.
Module Parts and Focus
The historical story of how we discovered the expanding universe provides a valuable picture of how science is performed. The online module walks students through the research performed by 20th century astronomers by giving them access to the same data that these astronomers collected. Students use an online graphing software called filtergraph to transform and fit data to create useful equations. These are the typical equations provided in lecture, but instead of being given a formula to use and being asked to calculate an answer, they are using raw data to create the formula themselves and will hopefully better understand the limitations and specific usages of the astronomical relations.
The goal of the online module is to provide students with hands on experience with fitting data and the process of doing science on a computer. The module itself is meant to guide the student through the assumptions made in experiments and question how those assumptions become folded into the final answer.
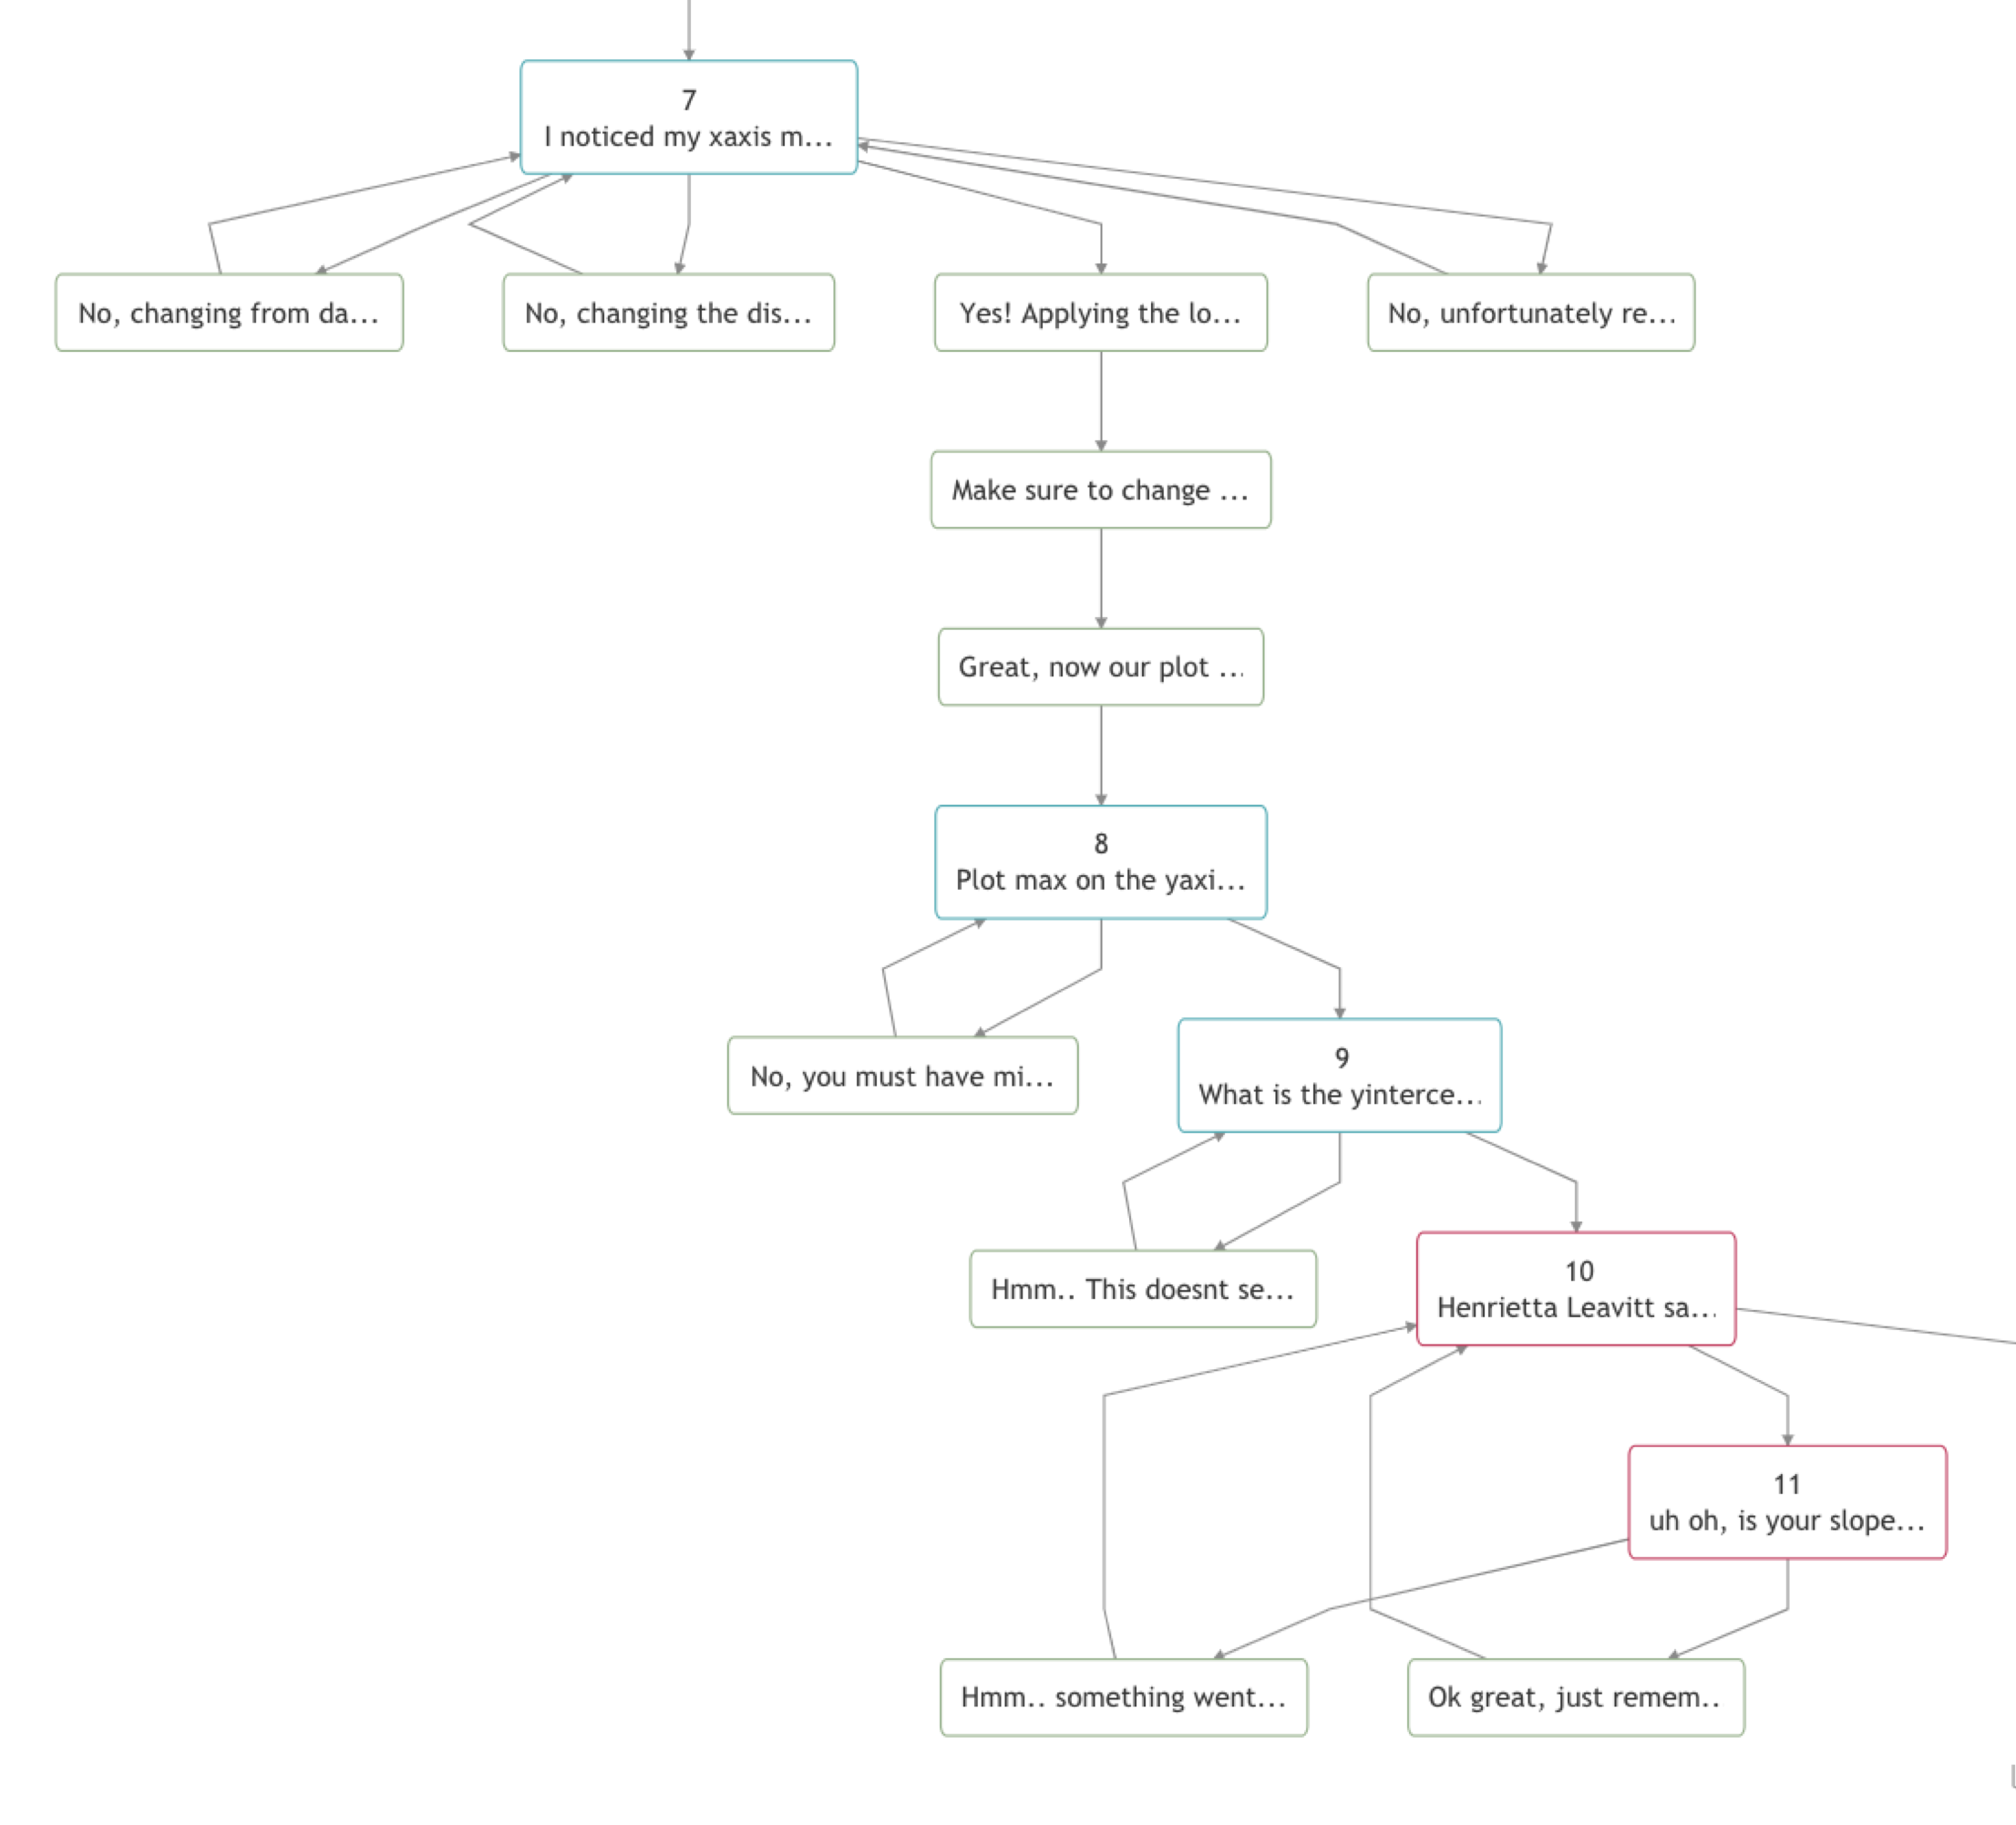
Students will be using a website called typeform to access content. I have built a three-part learning guide which allows response-driven feedback so that students answering questions incorrectly are provided with more explanation and step-by-step walkthroughs of the problems. The logic tree below shows a view of the map of how content is delivered. If a student answers a question in a particular way, the explanation given is based on what answer the student chose. This allows a more personalized learning experience than traditional online methods.
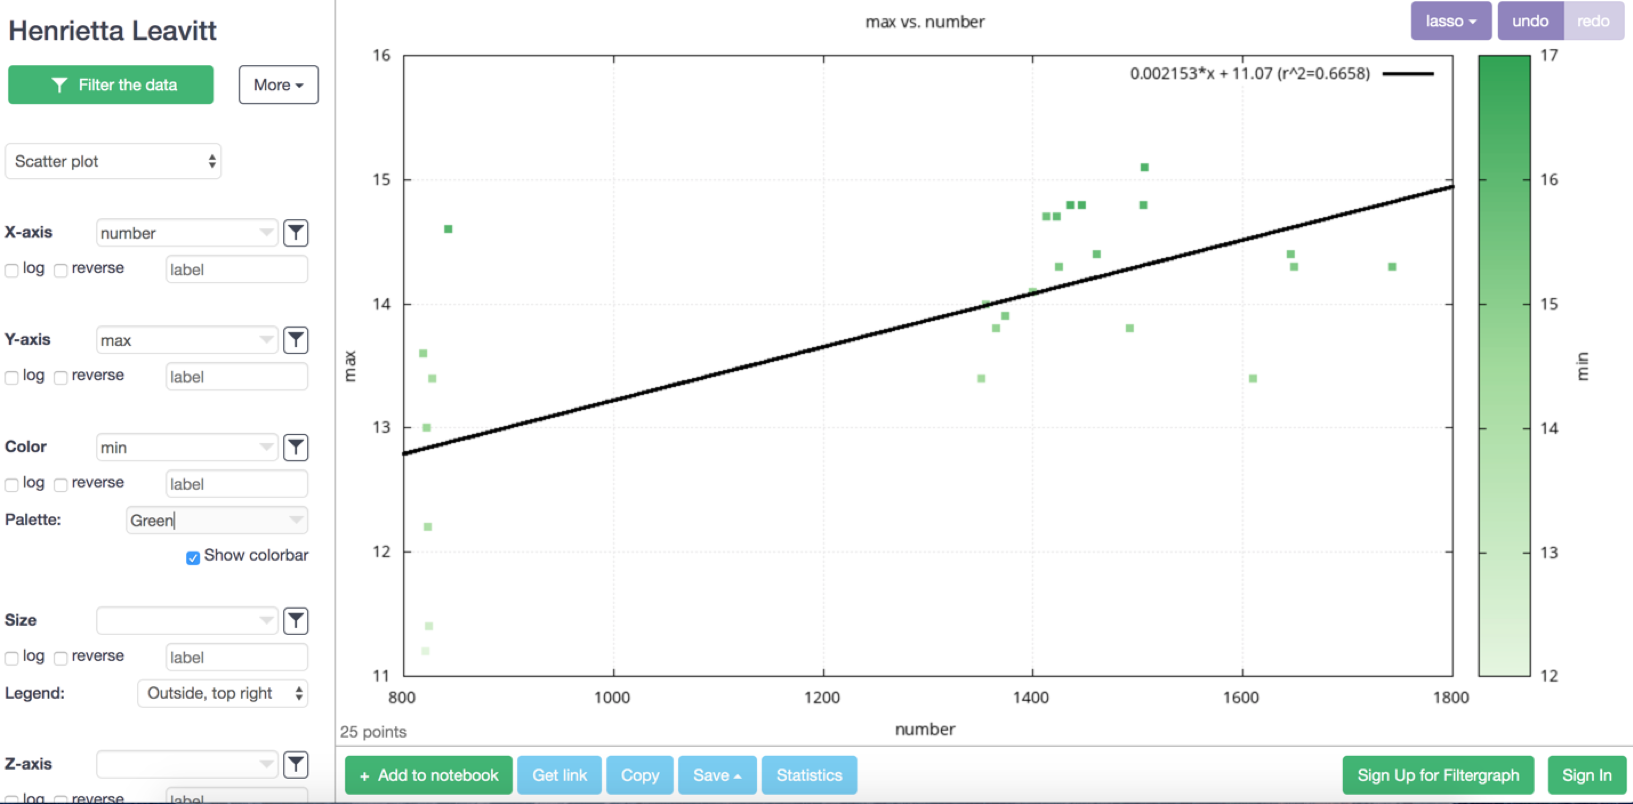
The module also provides instructions to accessing and plotting the data in filtergraph. Filtergraph is an online plotting tool that makes it easy to make immediate alterations to a plot and to get an equation for a line. Students are guided through plotting the Hubble data and uncovering relations that will allow them to make conclusions about the nature of the universe.
The three parts of the module cover the following:
-
- Period-Luminsoity Relation
-
-
- Plotting the Period Luminosity Relation and understanding distance measurements
- Assumptions made when measuring distances to other galaxies
- Hubble’s Law
- Plotting Hubble’s Law and measuring the Hubble constant
- What assumption Hubble made when creating a catalog of galaxies
- Interpretations of receding galaxies
- Assumptions we must all make in science – the cosmological principle
- What Went Wrong
- Calculate the age of the universe using the Hubble constant derived from data
- Assess the reasonableness of the answer and ask what went wrong
- Identify mistakes and assumptions made and hypothesize how that would affect our Hubble constant, and the age of the universe (increase or decrease?)
- Correct the values to modern day!
- Interpret results from data
-
Assessment Tools
We are trying to see if students who went through the creation of the formulas from data have a better understanding of what the formulas are telling us about the universe. We want to know if students are more familiar with limitations and assumptions built into the formulas and if they are more able to predict changes to one variable based on corrections in the experiment.
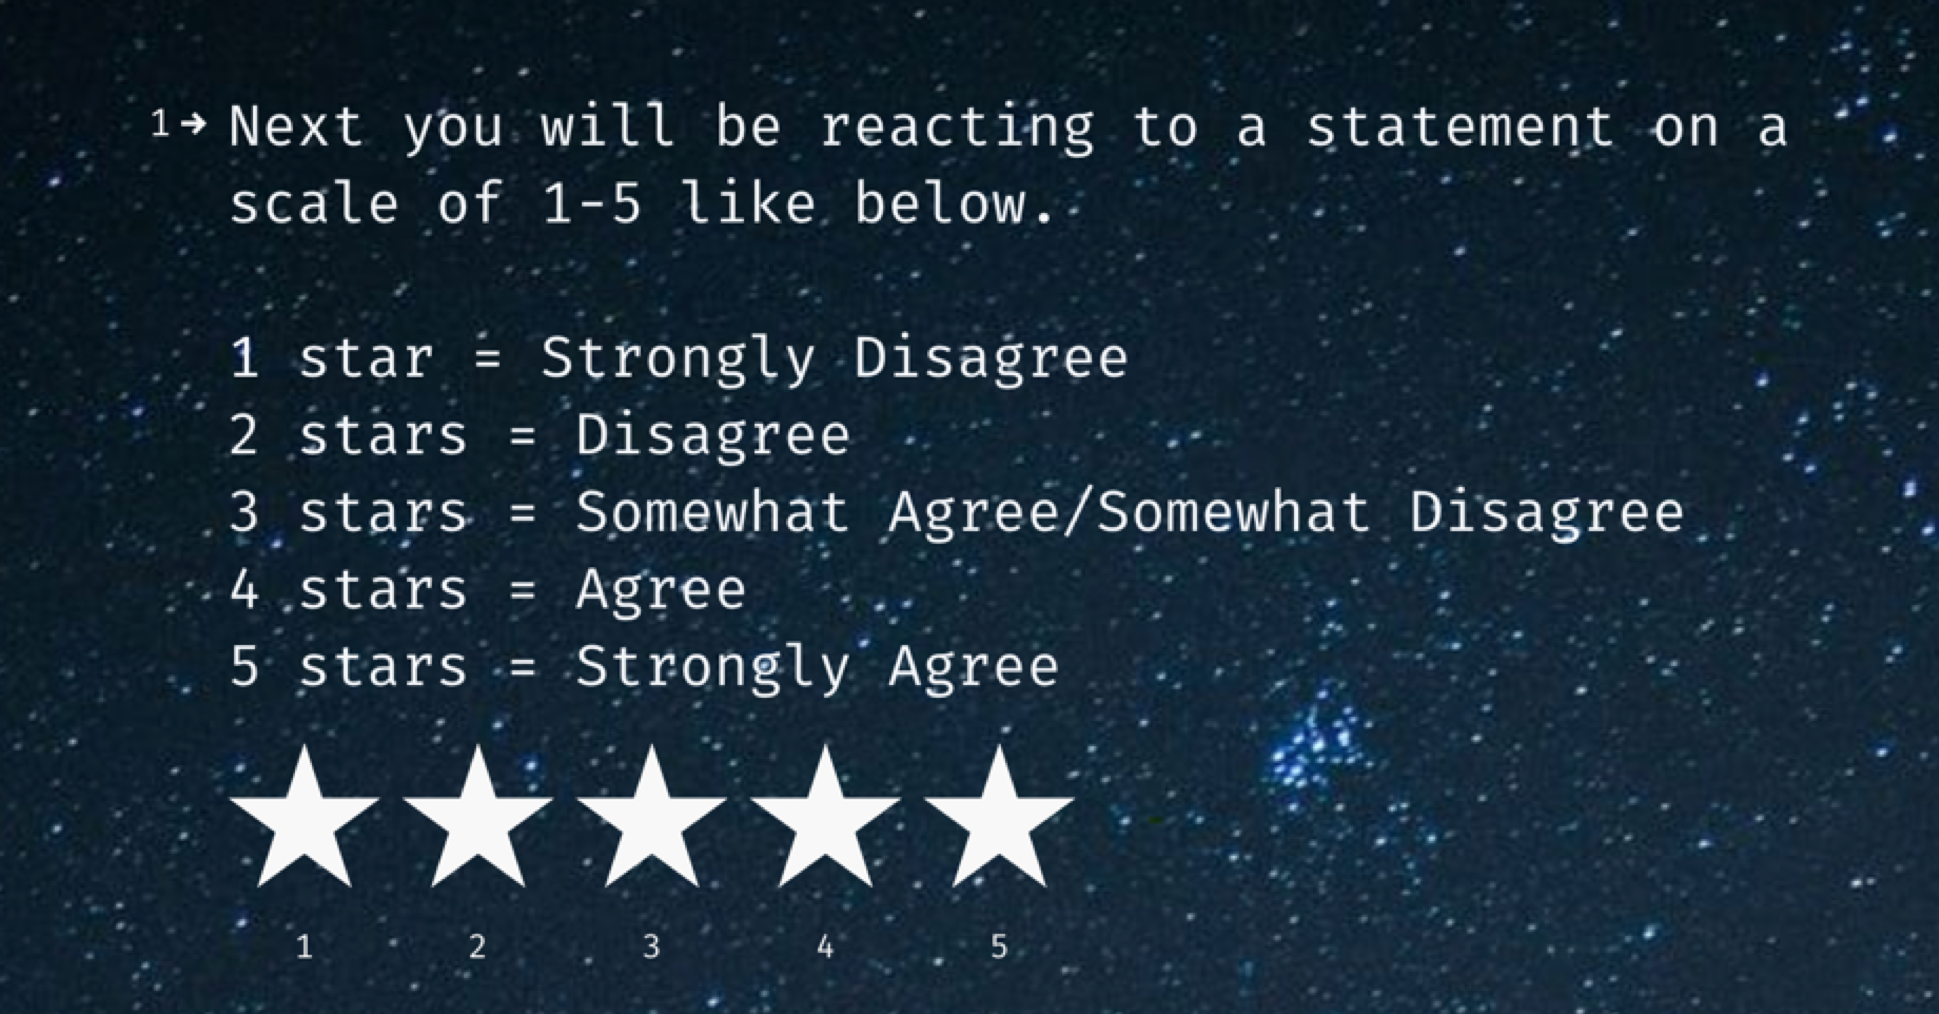
To gauge these skills we will ask students to answer a pre/post survey on the typeform that asks about their confidence in themselves to perform these tasks as well as their confidence and opinion on astronomical discoveries. The pre/post survey will allow us to see if students from one class had their opinions and confidence changed by the online module.
The second assessment is an exam question which will be included on the final. This is the same exam question from Fall 2019 which tests student’s ability to interpret Hubble’s published plot. They are asked to read the graph, calculate a new quantity from variables on the graph, interpret the reasonableness of that result, and make a prediction about how the graph would change under different circumstances. In this case the Fall 2019 class will act as the “control” by which the Maymester students will be measured against. This will give us an idea of the effectiveness of learning astronomy in this way.
Results
Coming Soon after Maymester data is collected