Counting the seeds inside cherry tomatoes provides a chance for students to see real variation, experiment with different ways of arranging data, and discuss ideas about typicality. The seed totals are easy to collect and yields a very rich data set that captures student interest and forces them to stretch their thinking.
This detailed account of the activity illustrates the importance of extended work in organizing and interpreting data.
Pairs of students predict a seed total for their cherry tomato, cut the tomato in half, use toothpicks to remove the seeds onto paper towels, and compare their actual count to their prediction. This process is repeated several times, allowing pairs to refine their predictions and gain more information about realistic seed totals for cherry tomatoes. Partners share their seed totals with the class and comment on what they have learned so far.
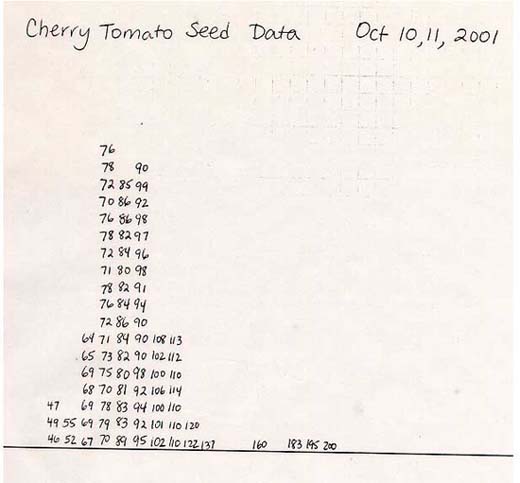
One surprising fact is that the biggest cherry tomatoes do not have the highest seed totals. Students find that the smaller tomatoes seem to have more seeds. Students are amazed at the variety of seed totals they find. Their first 44 totals range from 46 seeds to 195 seeds.
The class has been using line plots to explore frequency and variation within different data sets, but the seed totals for cherry tomatoes present a new challenge. The class has been using chart paper with a one-inch grid in a horizontal position to construct line plots. The teacher counts 33 one-inch spaces along the length of the chart paper and asks how to solve the problem of constructing a line plot to display the cherry tomato data. Students propose taping chart paper together to create a longer horizontal line. The teacher asks students to visualize this extra-long line plot beginning at 46 and ending at 195. She then has them think about placing 44 x's along this line to show the seed totals the class counted for their cherry tomatoes and asks, "What will you be able to learn from this line plot? Will it show you anything?"
The teacher asks the students to recall features they have discussed when analyzing other data displays and students respond that they talked about range, "holes," "chunks," "towers," and outliers. The teacher asks if they will be able to have a good discussion about the shape of the cherry tomato data and what it can tell them if they stretch it out along five sheets of chart paper. One student states that they will be able to see "two 69's, two 92's, two 83's, and three 110's." The teacher points out that the class can see those totals already on the list that was created as each pair of students listed the seed totals they had counted.
The teacher asks if they will be able to see any chunks or towers. The teacher pushes on the idea that the extra-long line plot will be harder to read and not much more useful than the random list, but the class seems happy with the plan to solve their display problem with five sheets of chart paper. The teacher imposes the constraint of a single piece of chart paper and asks how the class can find a way to display their seed totals for cherry tomatoes. There are complaints that the task is "impossible" but then one student suggests that "we could do it by tens." He explains that he means have one column for the 40's, one for the 50's, etc. the class figures out that 16 columns will be necessary for this display and agrees that they have enough space on the chart paper. The problem seems to be solved and the line plot is marked beginning with 40's and ending with 190's. the students become unhappy with the "tens" display when it is time to record their seed totals. Students point out that placing an "x" in the appropriate column for a seed total won't work with this new system because then they will lose track of the exact seed totals. For example, 78 seeds will look exactly like 70 seeds on the line plot. This is problematic for many students, until the teacher proposes recording the actual total in each square on the grid paper instead of the "x" the class has been using. That solution is acceptable to all and the data are recorded. The class notices a gap or hole in their data between 137 and 195. Some students suggest that the pair who got 195 seeds for a total may have made a mistake with their counting. This pair describes the system they used for counting seeds and explains that they double-checked their counting. The tallest column is the 80's. One student describes a "mountain" in the data beginning with the 60's and ending with the 110's. |