Mapping Self in Society (MaSelfS)
Mapping Self in Society (MaSelfS)
Directors: Rogers Hall, Peabody & Ben Rydall Shapiro, Georgia State University
Collaborators: Sachin Bangalore, Emma Reimers
About
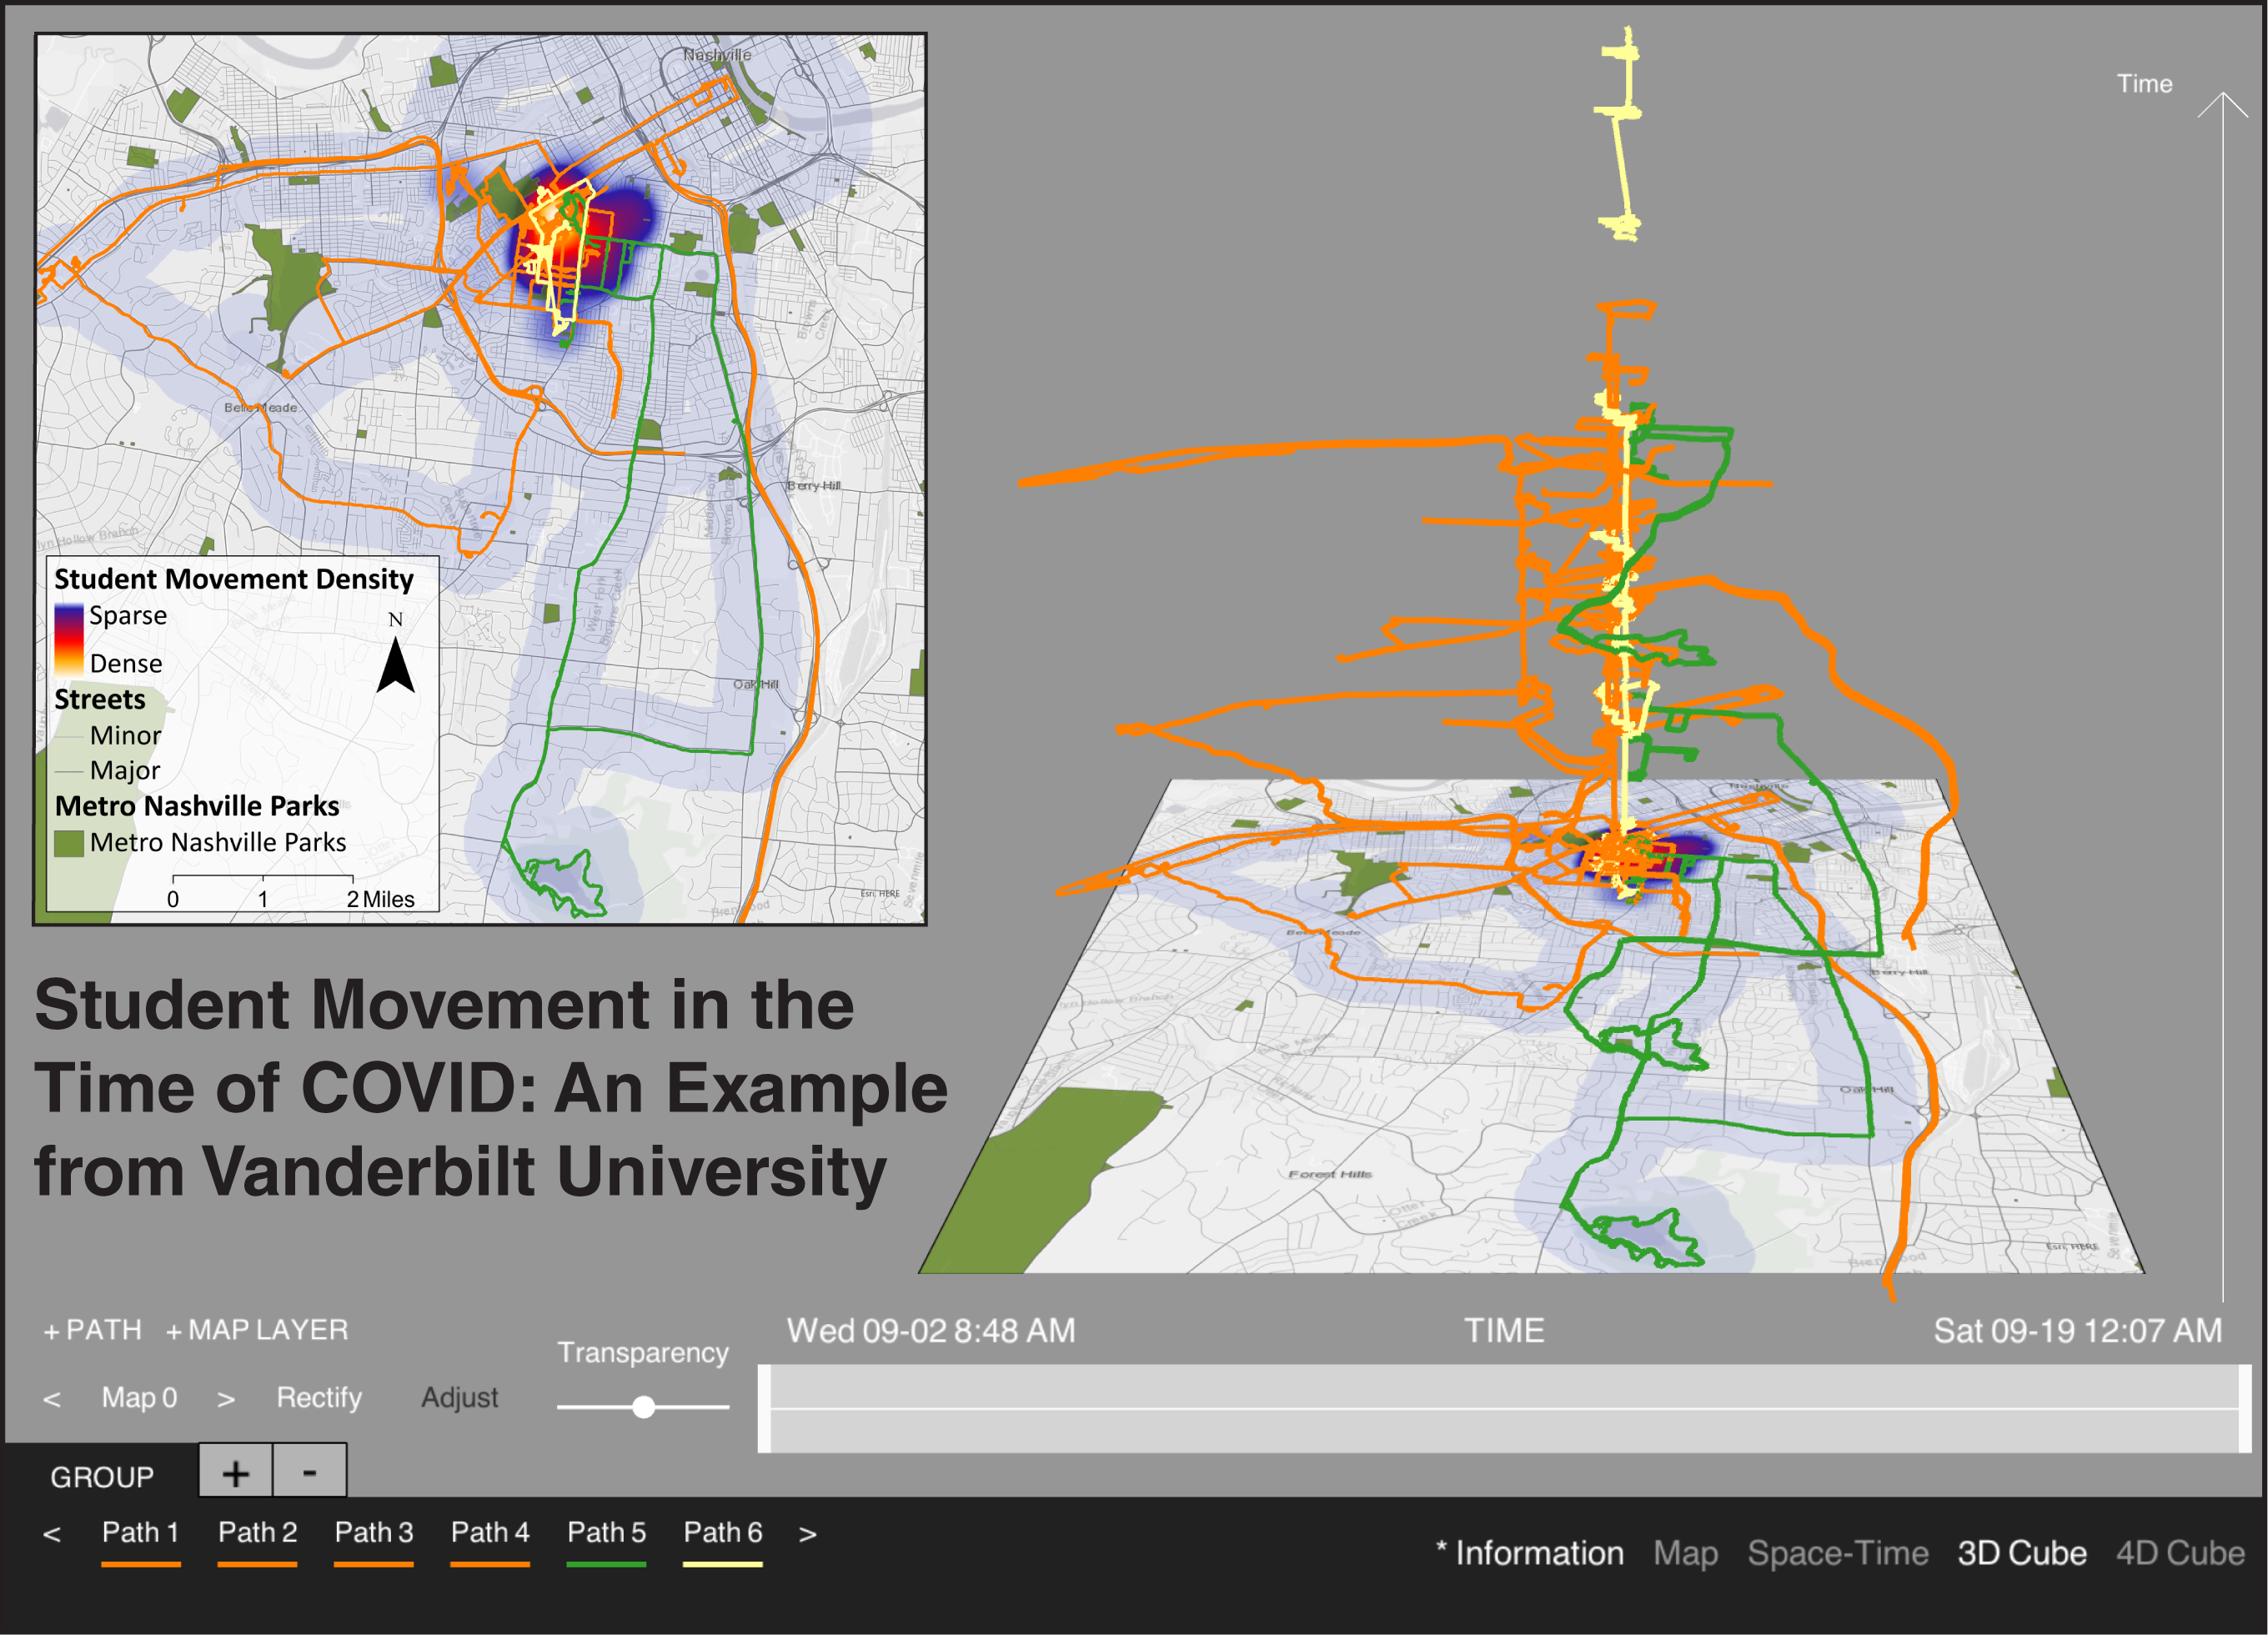
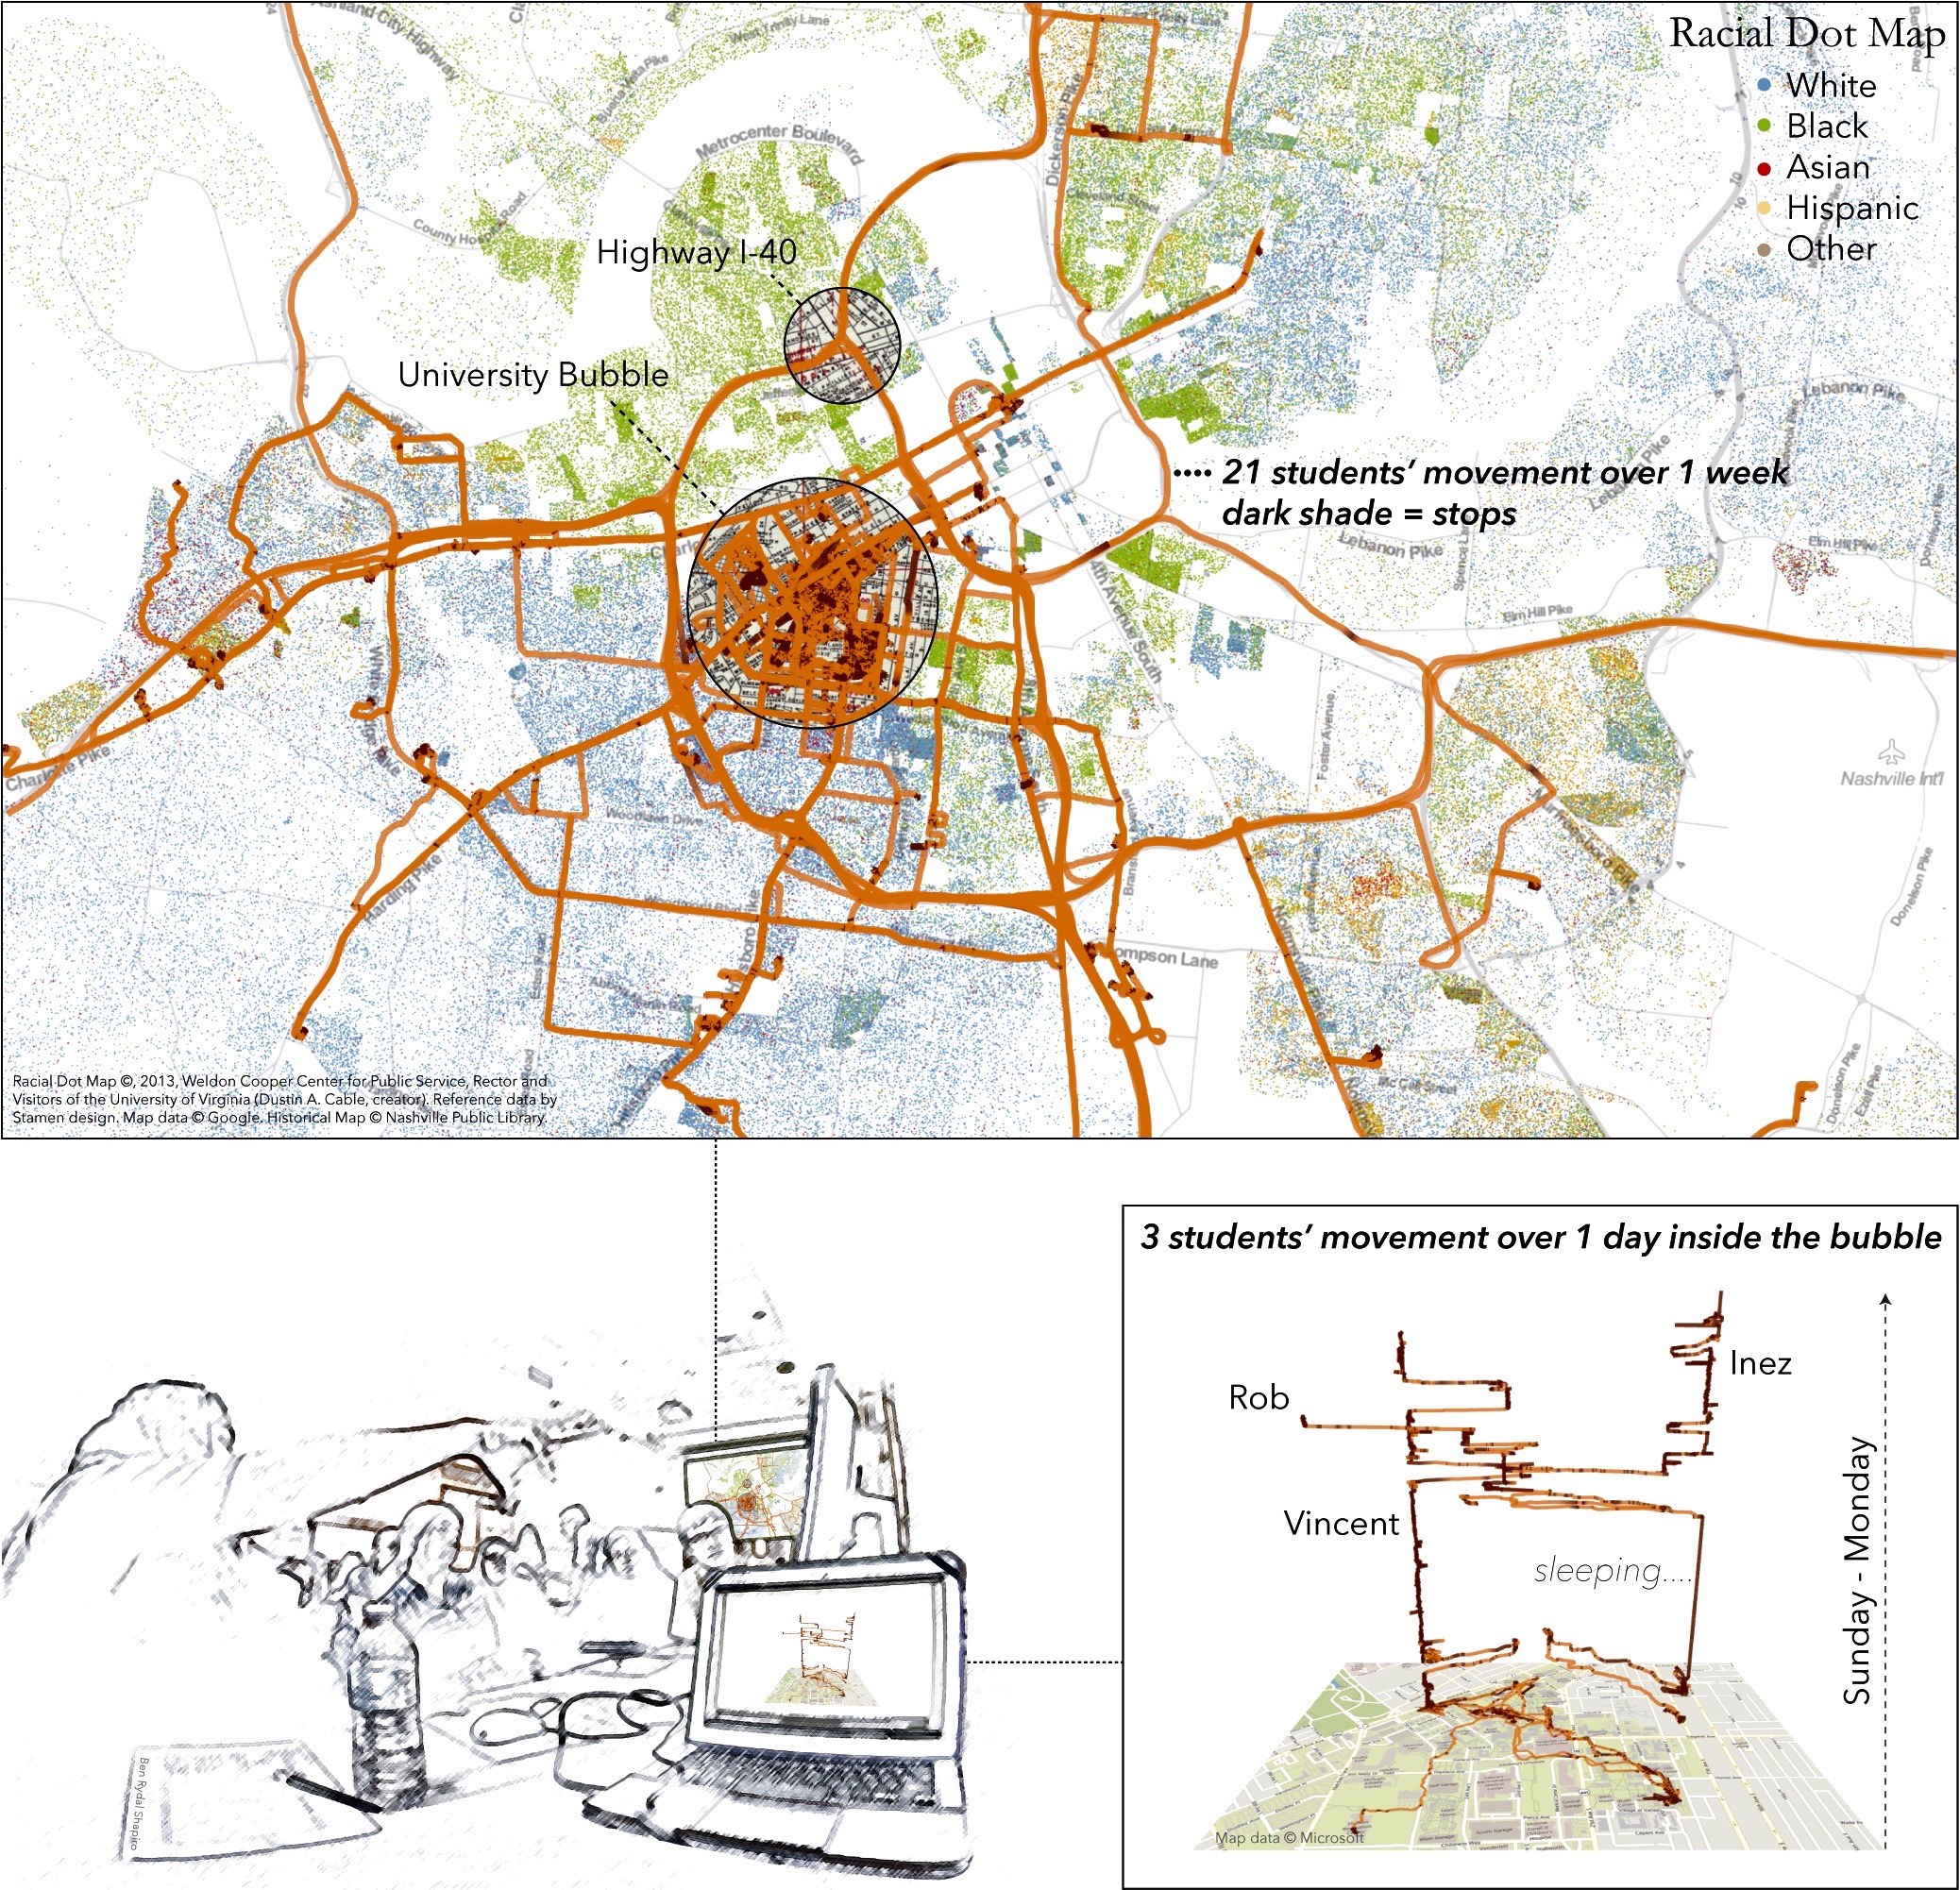
Mapping Self in Society (MaSelfS) is a framework for teaching personal geography and critical spatial inquiry. Teachers working in different disciplines such as social studies or computer science can use this framework to engage learners in activities where they learn how to use open source tools to collect and dynamically visualize their physical movement data over thematic maps to explore relations between people and the social and cultural life of neighborhoods and communities. These activities align the experience of personal geography with analyses of society and integrate ideas in human geography with contemporary ideas about data ethics and computational analysis. The framework is also designed for researchers who are considering using new location-based technologies in ethically sensitive ways for research about public history, critical spatial and computational analysis of human geography, and design studies of learning on the move.
Personal Geography & Critical Spatial Inquiry
Research Goal: Understand how a persons personal movement relates to society at a community scale and foster discussions about the ways in which society influences movement and vise versa.
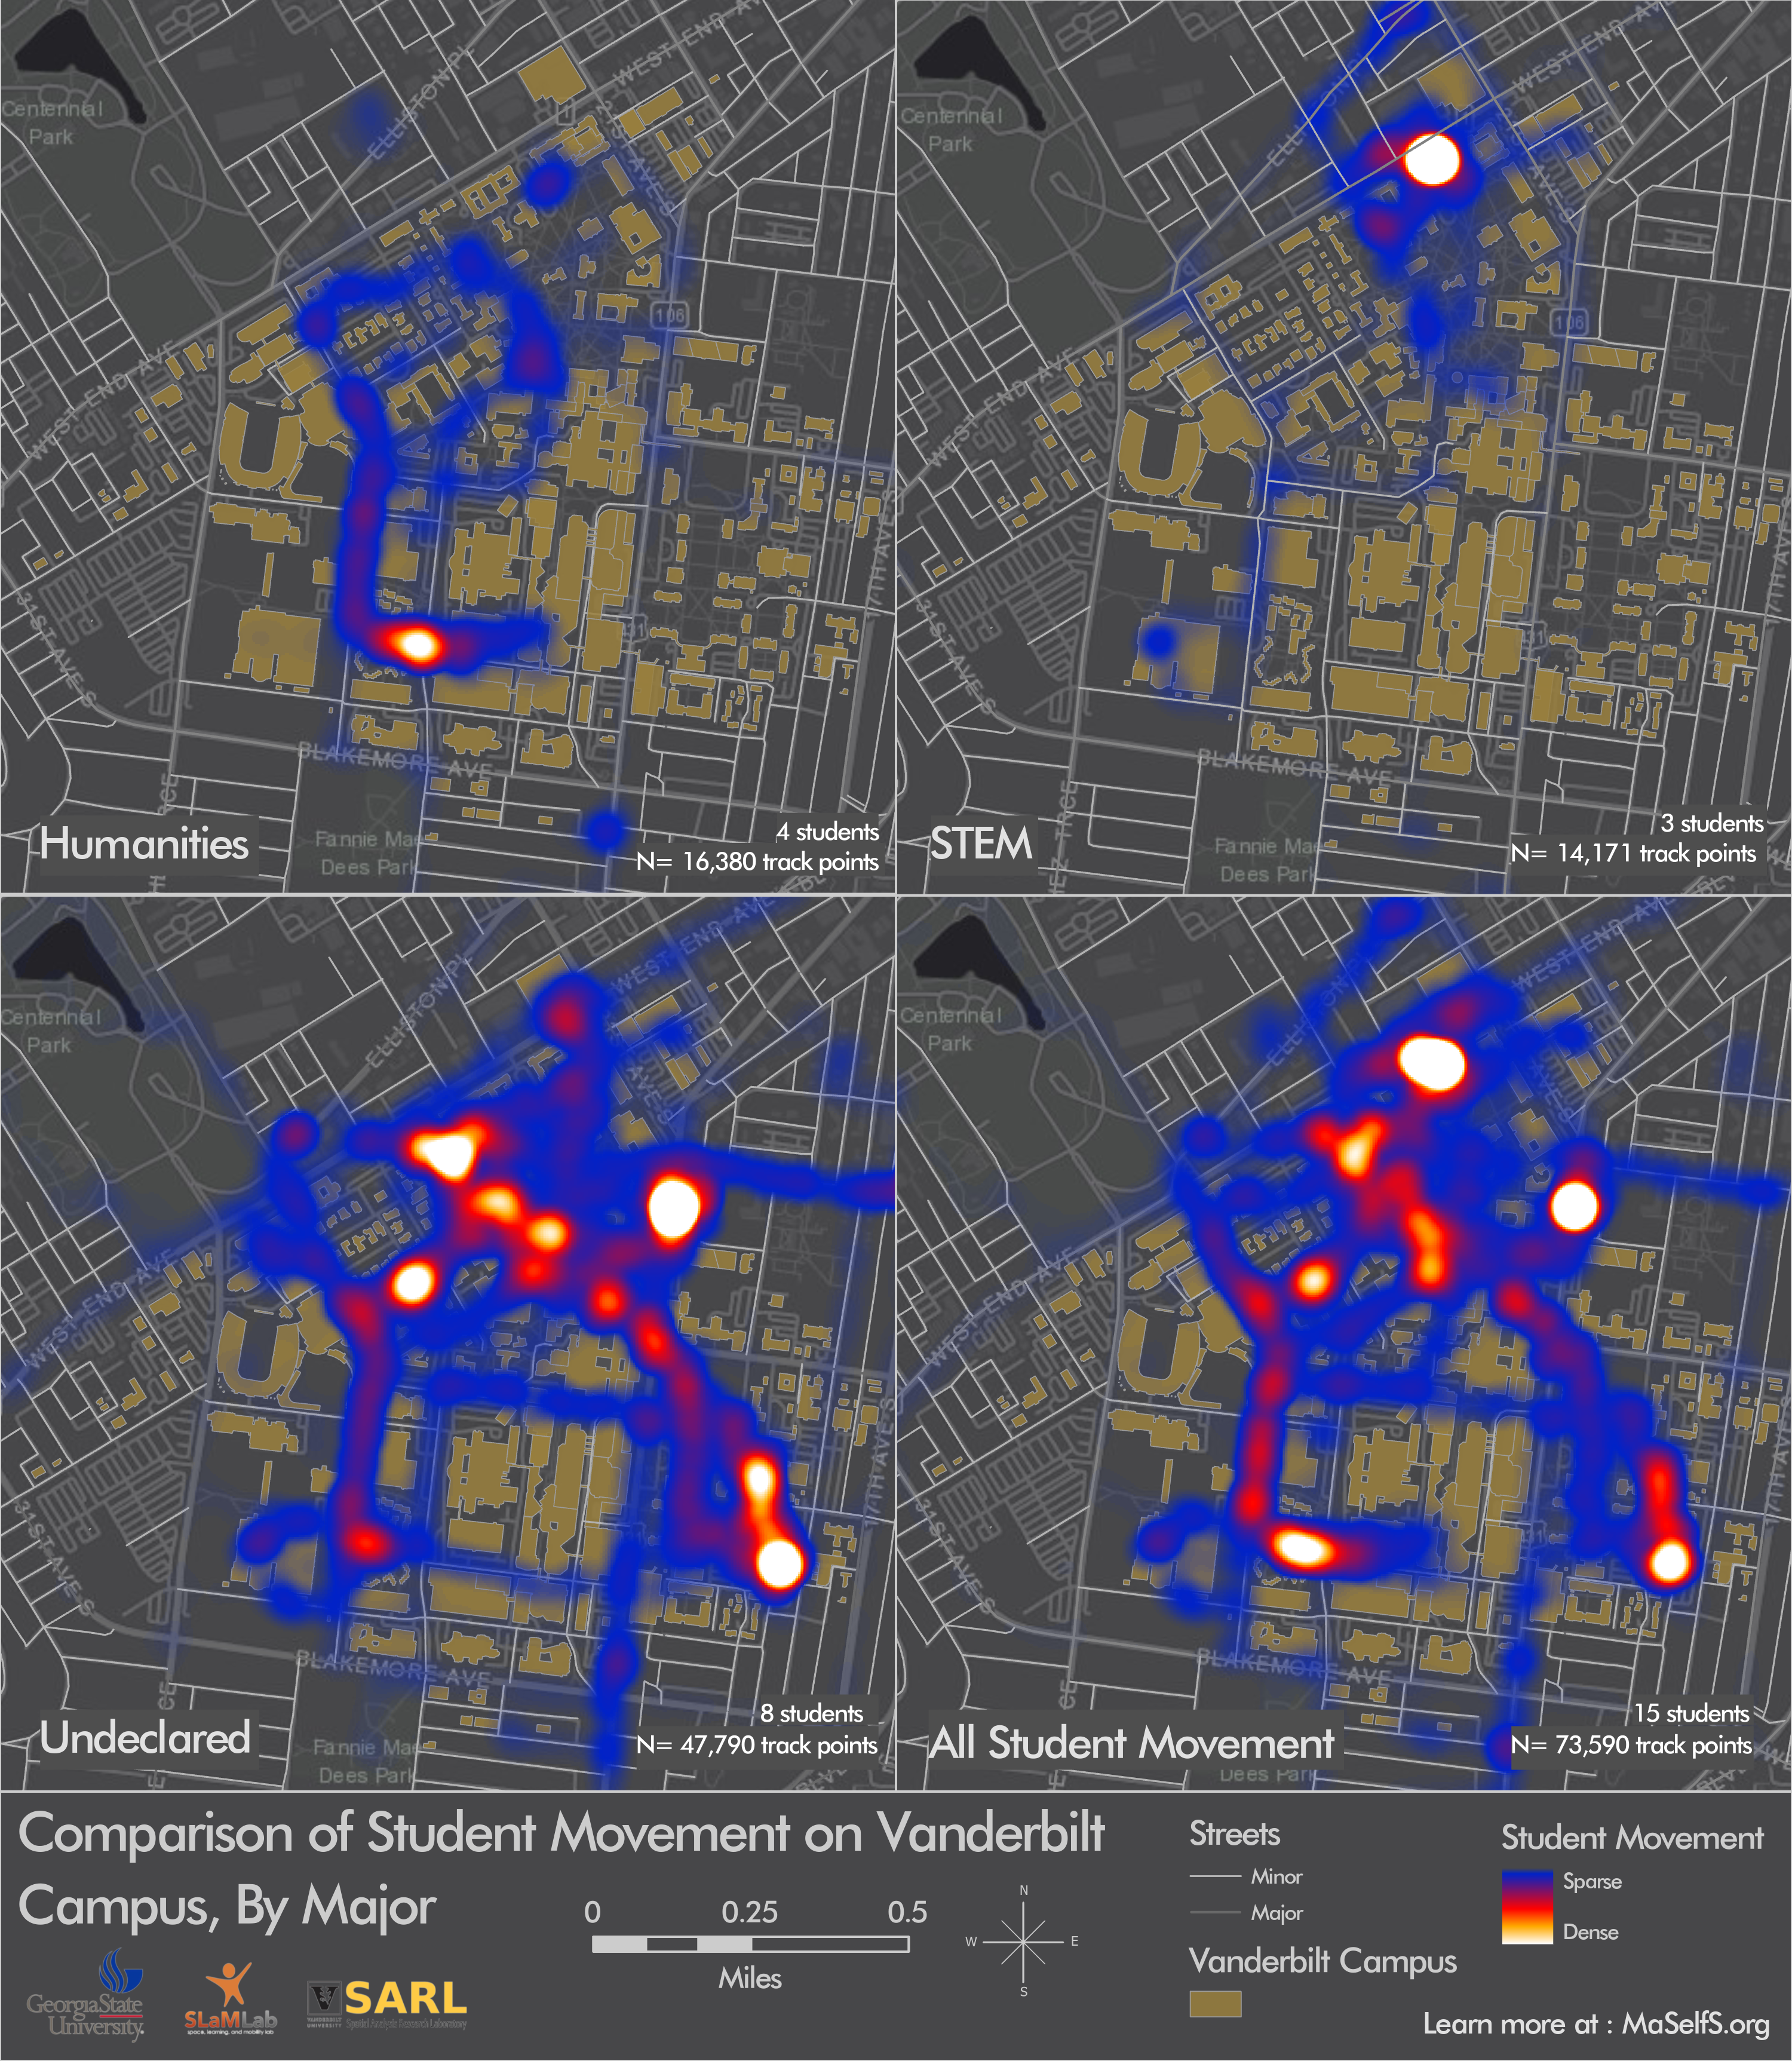
Methods: The MaSelfS website brings together open source tools for gathering data on personal mobility, structuring these data to explore the “daily round” of personal experience at community scale, and visualizing personal geography over time and thematic maps created with larger data sets in these communities. Sections of the website are organized as a sequence of 5 activities that are summarized below. Concepts and tools introduced in each activity can be used separately, or recombined to create novel forms of teaching or research. This work is a collaboration between researchers and teachers at Georgia State University and Vanderbilt University and is generously supported by the Spencer Foundation and the National Science Foundation.