Physics Demo Number: 150
Approximate
Run Time: 10 min
Sound Waves Displayed on Science Workshop Interface
Demo Description
A sound sensor is attached to a Science Work Shop 750 Interface and then into the lecture hall PC via a USB port.
Running the saved activity for 'sound_scope.ds' gives one a scope reading of the sounds produced , along with a FFT display of the sound waves.
Scientific Principles
-
Spectral analysis of sound waves is carried out by the Data Studio software and displayed.
Equipment
-
Pasco Sound Sensor
-
Science Workshop 750 Interface
-
Tuning Forks and Organ Pipes
Equipment Location
-
Kit (150) on [D-1-4].
-
Kit (150) on [D-1-4].
-
On Shelf [D-1-4].
Instructions
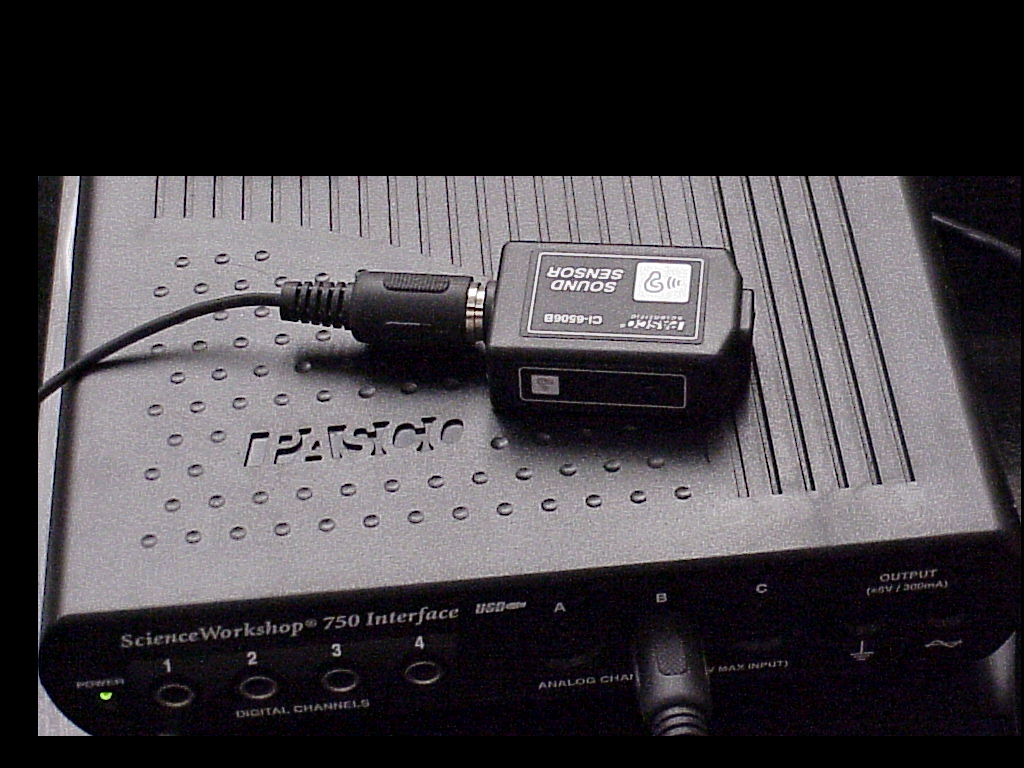
The
first photo shows the Pasco sound sensor attached to the Science
Workshop 750 Interface, which in turn is attached to a USB port
of the Lecture Hall PC.
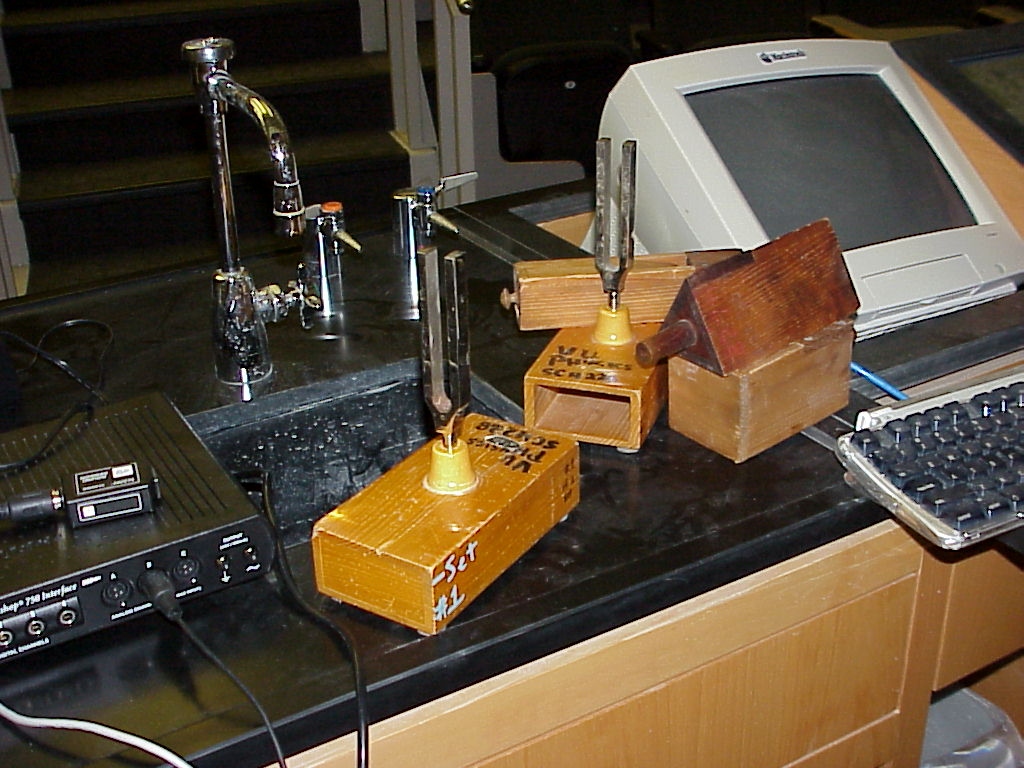
The
second photo shows tuning forks and organ pipes to provide sound
sources.
The sensor is setup to display in oscilloscope mode on the Lecture Hall Interface when the Data Studio software is run and the activity file named below is chosen.
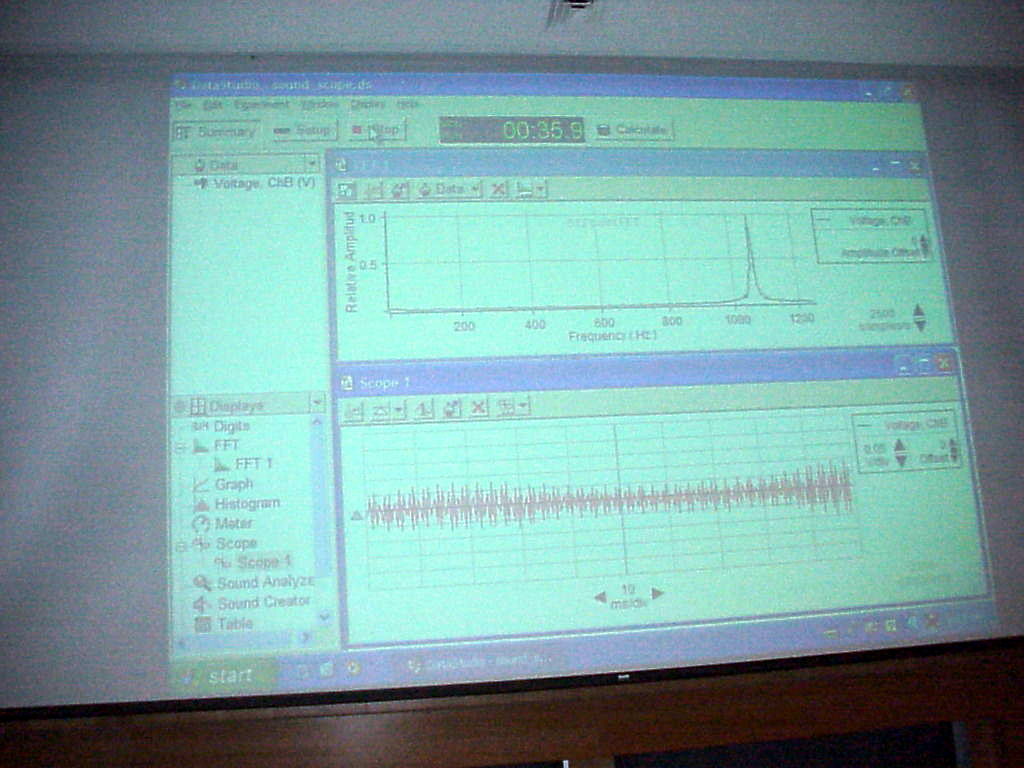
The
third photo shows a view of the screen for the scope in action per
activity file
'' C:\program files \data studio\physics\sound_scope.ds'' .
Note that the file sets up not only a scope screen but also a FFT display for the signal.
The scope output is on the bottom in the above photo and not too impressive.
However the FFT gives nice sharp component frequency readouts.
Writeup created by David A. Burba
Copyright © 2011, Vanderbilt University. All Rights Reserved.