2019 Economic Impact Report
Download a PDF of the 2019 Vanderbilt Economic Impact Report
Summary
Since 1873, Vanderbilt University and the Vanderbilt University Medical Center have provided enormous social and economic benefits to the state, nation and rest of the world.1 These benefits manifest themselves in a variety of ways. First, direct Vanderbilt institutional spending on payroll, construction and general procurement creates sales for companies located in Nashville and elsewhere throughout Tennessee. Next, spending by students and out-of-town visitors off campus brings additional revenue to local businesses. Beyond these direct injections, Vanderbilt also plays an important role in local economic development by providing labor force and research commercialization. Finally, students, faculty and staff of Vanderbilt contribute thousands of hours of community service each year, promoting health, literacy, education, culture and overall regional quality of life.
The following findings illustrate Vanderbilt’s importance:
- Together, Vanderbilt institutions are the largest private employer in the Nashville region and the second-largest private employer based in the state.
- Vanderbilt University and VUMC collectively employ a total of approximately 33,200 faculty, staff, and medical professionals who serve a student population of just under 12,600. On the medical side, there were approximately 2.4 million visits last year, along with $591 million in research awards and $711 million in charity care, community benefits and other unrecovered costs.
- In 2017-18, Vanderbilt conferred 3,855 degrees. Since 2010, the university has awarded approximately 30,000 degrees.
- Vanderbilt-related operations, along with student and visitor spending, generated an economic impact of $11.9 billion in economic activity, approximately 79,200 jobs and more than $4.2 billion in labor income, an impact that has grown significantly in the last two years. This equals $279.2 million in tax revenue for the State of Tennessee.
Table 1: Economic Impact of Vanderbilt FY 2017-18
| Output | Value Added | Labor Income | Employment | |
|---|---|---|---|---|
| Vanderbilt University | $2,667,891,858 | $1,604,994,885 | $1,175,387,500 | 10,672 |
| VUMC | $8,122,171,434 | $4,698,448,300 | $2,842,561,222 | 59,285 |
| Construction Spending | $777,879,600 | $451,562,400 | $283,872,600 | 5,796 |
| Student/Visitor Spending | $372,314,092 | $224,441,329 | $111,132,579 | 3,372 |
| Total | $11,940,256,984 | $6,979,446,914 | $4,229,707,863 | 79,199 |
Source: TXP, Inc. Note: See definitions of economic impact terms used.
Introduction
Vanderbilt University, located in Nashville, Tennessee, historically has been a private research university and associated medical center offering a full range of undergraduate, graduate and professional degrees. Founded in 1873, the school offers an invigorating atmosphere where students tailor their education to meet their goals and researchers collaborate to solve complex questions affecting health, culture and society.
As of spring 2016, Vanderbilt University Medical Center became a fully independent, nonprofit entity, separate legally and financially from Vanderbilt University. The transition positions VUMC for future growth and investment, while preserving its tightly woven connections to the university in research and teaching. As an independent entity, VUMC has direct capital market access to assure it can compete effectively in the health marketplace. Its new flexible governance structure also supports the continued growth of the Vanderbilt Health Affiliated Network, which is the largest provider-organized network of doctors, regional health systems and other health care providers in Tennessee and surrounding states. Teaching and research collaboration and connections between the university and the medical center remain a strategic priority for both institutions. For purposes of this economic impact analysis, the two institutions (the university and VUMC) will continue to collectively comprise “Vanderbilt.”
For academic year 2017-18, Vanderbilt had an annual full-time enrollment of 6,805 undergraduates and 4,977 graduate and professional students, as well as 810 part-time students, for a total enrollment of 12,592. Consistently ranked among the top universities in the nation, Vanderbilt draws students from all 50 states, with approximately 11 percent of the student body coming from overseas. Vanderbilt undergraduates can pursue one or more majors in four undergraduate schools and colleges: the College of Arts and Science, the School of Engineering, Peabody College of education and human development and the Blair School of Music. Additionally, Vanderbilt has six graduate and professional schools: Divinity School, Graduate School, Law School, School of Medicine, School of Nursing, and Owen Graduate School of Management.
As an independent, privately supported university and medical center employing 4,716 full- and part-time faculty and 28,485 full- and part-time staff members, Vanderbilt is the largest private employer in the Nashville area and the second-largest private employer based in the state.
Not only do Vanderbilt operations have a significant economic impact, but its students and graduates also increase the state’s economic development competitiveness and productivity by gaining knowledge, improving technical skills and commanding a higher salary when entering the job market. In 2017-18, 3,855 students earned undergraduate, graduate and professional degrees.
VUMC also plays an important part in improving Tennessee’s overall quality of life and economic vitality beyond its direct role in the economy. In FY 2017-18, for example, the total value of charity care, community benefits and other unrecovered costs provided by VUMC was approximately $711 million.
A wide range of visitors, including prospective students, parents, graduates, sport fans and business leaders, travel to Nashville to take advantage of conferences, alumni events, sporting events and medical services associated with Vanderbilt. Out-of-town visitors help support cultural institutions and entertainment attractions that improve the quality of life for local residents who do not directly interact with the university. The direct spending by these guests also provides revenue to local businesses.
The purpose of this assessment is to quantify the total annual economic and tax revenue impact of Vanderbilt. Building upon existing studies and datasets, this analysis highlights the importance of Vanderbilt in terms of jobs, wages and taxes for FY 2017-18.
Economic and Tax Revenue Impact of Vanderbilt
Vanderbilt has a strong impact on the economy, as the operations of the school support thousands of direct and indirect jobs. Beyond these impacts, Vanderbilt plays an important role in regional economic development. Faculty and staff, for example, provide business support and other technical services to existing firms. In terms of job creation, patents and business start-ups resulting from the commercialization of Vanderbilt academic research are sources of economic development throughout Tennessee. Students, faculty and staff of Vanderbilt also provide thousands of hours of community service each year, enhancing health, literacy, education, culture and overall quality of life.
When evaluating the economic impact of Vanderbilt, the challenge is to focus on core activities that are measurable, while not overlooking important qualitative aspects. Some studies take a narrow approach that focuses on the operational impact of the institutions while other analyses include a variety of impacts ranging from alumni income to estimating the media value of collegiate sports teams. This study takes a measured approach but does make some subjective decisions regarding inputs.
Vanderbilt’s impact also includes the operations of VUMC. With 1,091 licensed hospital beds, VUMC hosted almost 67,000 surgical procedures and 2.4 million visits last year, while in the process of training over 1,050 residents.
Technology Transfer & Commercialization
The role that Vanderbilt plays in technology-related entrepreneurship has grown substantially over the years. The Vanderbilt Center for Technology Transfer and Commercialization reports that its revenue from technology license agreements was $17.2 million during FY 2017-18. Key to carrying out CTTC’s mission is the ability to form collaborative and professional relationships with companies in a variety of industries including space exploration, education, pharmaceuticals, health care/patient care, robotics, energy, environmental preservation, engineering and others.
The results are impressive. In FY 2017-18, 273 patent applications were filed and 59 patents were issued to firms associated with CTTC. Meanwhile, five new startups joined the dozens of companies created since CTTC’s inception. Among other benefits, these companies create good jobs at good wages. Although specific salary information is not available, virtually all of these companies are technology or life sciences companies that require the services of highly skilled and trained professional and technical employees. Life Sciences Tennessee, a biotech trade group representing biotech employers in the state of Tennessee, has data that the average local biotech worker makes approximately $83,000 per year. Anecdotal information suggests that workers in the nonbiotech startups associated with CTTC earn wages that are considerably higher than the U.S. average as well.
Model Inputs & Assumptions
Normal Operations and Expenditures Associated with Vanderbilt University and VUMC
During FY 2017-18, operations spending (including payroll) totaled $3.8 billion ($1.2 billion by Vanderbilt University and $2.6 billion by VUMC), the largest inputs to the economic impact model. The econometric model was adjusted for each institution based on the following inputs. Each segment, for instance, has a different spending pattern for faculty and a different average wage level.
- Operations: expenditures related to general operations and plant operations and maintenance;
- Payroll: salaries, wages and fringe benefits; and
- Employment: faculty and staff including graduate teaching or research assistants.
Construction Spending
This includes spending on buildings and construction, excluding equipment. This input has the greatest variation from year to year but is included since it generates a significant level of economic activity. Total annual construction spending in FY 2008-09 surpassed $181.5 million, fell to $86.6 million in FY 2011-12, then rose to $126.0 million in FY 2013-14 and $196.9 million in FY 2015-16. Last year, Vanderbilt University’s construction spending was $161 million, while VUMC spent $193 million, for a total FY 2017-18 Vanderbilt-related construction spending of $354 million.
Student and Visitor Spending
Enrolled students (graduate and undergraduate) have a positive impact on the local economy by supporting businesses such as restaurants, music venues, rental housing and other retail establishments. Because of Vanderbilt’s academic quality and reputation, the assumption is that undergraduate students likely would attend college outside the Nashville area if not for the presence of Vanderbilt. At the same time, visitors also inject funds into the local economy. According to Vanderbilt, more than half a million families, friends, conference participants and sporting events attendees come to the area each year. Out-of-town visitor counts were combined with the average expenditure per visitor and length-of-stay statistics published by the Nashville Convention and Visitors Bureau. Together, students and visitors accounted for $203.1 million in direct spending last year in the local economy.
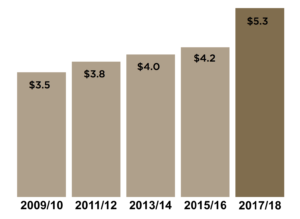
In total last year, the Vanderbilt-related direct spending footprint was $5.3 billion, a figure that has grown more than 25 percent since 2015-16.
Figure 1: Total Direct Economic Activity Related to Vanderbilt ($Billions)
Economic Impact Methodology
Economists use a number of statistics to describe regional economic activity. Four common measures are “output,” which describes total economic activity and is generally equivalent to a firm’s gross sales or top-line; “value added,” which equals gross output of an industry or a sector less its intermediate inputs or purchases from other firms used in the production process; “labor income,” which corresponds to wages and benefits; and “employment,” which refers to jobs that have been created in the local economy.
In an input-output analysis of new economic activity, it is useful to distinguish three types of expenditure effects: direct, indirect, and induced.
- Direct effects are changes associated with the immediate effects or final demand changes. Spending by students for entertainment, clothing, food, etc. off campus while they attend Vanderbilt are examples of direct effects.
- Indirect effects are changes in backward-linked industries caused by the changing input needs of directly affected industries— typically, additional purchases to produce additional output. Satisfying the demand from students means that restaurants must purchase food, supplies and other services. These downstream purchases affect the economic output of other local merchants.
- Induced effects are the changes in regional household spending patterns caused by changes in household income generated from the direct and indirect effects. The restaurant owner experiences increased income from student spending, as does the cleaning supplies outlet. Induced effects capture the way in which increased income is spent in the economy.
DIRECT + INDIRECT + INDUCED = TOTAL
A multiplier reflects the interaction between different sectors of the economy. An output multiplier of 1.4, for example, means that for every $1,000 injected into the economy, all other sectors produce an additional $400 in output. The larger the multiplier, the greater the economic impact. Since Vanderbilt is located in the Nashville area, TXP used the RIMS II input-output multipliers produced by the U.S. Bureau of Economic Analysis for the Nashville-Davidson-Murfreesboro-Franklin, Tennessee, Metropolitan Statistical Area. This is a conservative approach, since MSA multipliers tend to be lower than statewide figures.
Economic Impact Results
Vanderbilt University Operations Spending
In FY 2017-18, Vanderbilt University had direct operating expenditures of $1.2 billion, wages and benefits of $665 million and approximately 6,300 full- and part-time employees. The estimated total economic output impact related to Vanderbilt operations that year was approximately $2.7 billion. The increase in regional economic activity supported about 10,700 total jobs with labor income of almost $1.2 billion.
Table 2: Vanderbilt University Economic Impact FY 2017-18: Operations
| Industry Sector | Output | Value Added | Labor Income | Employment |
|---|---|---|---|---|
| Agriculture | $3,609,975 | $1,564,323 | $1,062,051 | 14 |
| Mining | $1,203,325 | $721,995 | $303,443 | 2 |
| Utilities | $42,597,705 | $22,863,175 | $8,192,968 | 29 |
| Construction | $22,381,845 | $12,634,913 | $8,951,576 | 52 |
| Durable Mfg. | $33,211,770 | $11,672,253 | $7,737,803 | 50 |
| Non-Durable Mfg. | $86,158,070 | $27,195,145 | $18,358,318 | 128 |
| Wholesale trade | $68,830,190 | $46,689,010 | $27,006,451 | 132 |
| Retail trade | $104,328,278 | $69,431,853 | $45,819,934 | 494 |
| Trans./Warehouse | $49,095,660 | $25,390,158 | $20,634,142 | 152 |
| Information | $67,747,198 | $38,867,398 | $16,841,101 | 107 |
| Finance/Insurance | $151,378,285 | $78,817,788 | $48,550,923 | 326 |
| Real Estate | $370,263,103 | $259,316,538 | $72,826,384 | 815 |
| Prof./Tech. Services | $74,004,488 | $47,531,338 | $39,751,068 | 234 |
| Mgmt. of Companies | $27,676,475 | $16,605,885 | $14,413,555 | 64 |
| Admin. Services | $60,406,915 | $38,987,730 | $32,468,430 | 367 |
| Educational Services | $1,224,262,855 | $744,376,845 | $673,644,056 | 6,427 |
| Health Care, etc. | $124,423,805 | $74,365,485 | $69,033,344 | 452 |
| Arts/Recreation | $16,124,555 | $9,626,600 | $7,889,525 | 86 |
| Accommodation | $20,095,528 | $12,755,245 | $6,979,195 | 72 |
| Eating/Drinking | $46,689,010 | $24,668,163 | $19,268,648 | 314 |
| Other services | $73,402,825 | $39,589,393 | $33,985,646 | 308 |
| Households | $1,668,938 | 47 | ||
| Total | $2,667,891,858 | $1,604,994,885 | $1,175,387,500 | 10,672 |
Source: TXP, Inc. Note: See definitions of economic impact terms used.
VUMC Operations Spending
In FY 2017-18, VUMC had direct operating expenditures of $3.6 billion, wages and benefits of $2.2 billion and approximately 24,350 full- and part-time employees. The estimated total economic output impact related to Vanderbilt operations that year was approximately $8.1 billion. The increase in regional economic activity supported almost 59,300 total jobs with labor income of $2.8 billion.
Table 3: VUMC Economic Impact FY 2017-18: Operations
| Industry Sector | Output | Value Added | Labor Income | Employment |
|---|---|---|---|---|
| Agriculture | $8,312,639 | $3,614,191 | $2,168,515 | 81 |
| Mining | $2,891,353 | $1,807,096 | $361,419 | 10 |
| Utilities | $84,210,650 | $46,623,064 | $13,011,088 | 132 |
| Construction | $43,731,711 | $24,576,499 | $13,733,926 | 245 |
| Durable Mfg. | $96,860,319 | $36,141,910 | $18,070,955 | 347 |
| Non-Durable Mfg. | $213,598,688 | $71,199,563 | $36,864,748 | 771 |
| Wholesale trade | $263,113,105 | $178,541,035 | $81,680,717 | 1,214 |
| Retail trade | $312,627,522 | $208,538,821 | $109,148,568 | 3,539 |
| Trans./Warehouse | $155,048,794 | $80,957,878 | $52,405,770 | 1,171 |
| Information | $204,924,630 | $117,099,788 | $41,563,197 | 805 |
| Finance/Insurance | $754,643,081 | $396,838,172 | $188,660,770 | 3,654 |
| Real Estate | $727,536,648 | $510,685,188 | $114,931,274 | 3,817 |
| Prof./Tech. Services | $326,361,447 | $216,851,460 | $147,820,412 | 2,669 |
| Mgmt. of Companies | $105,534,377 | $63,248,343 | $43,731,711 | 591 |
| Admin. Services | $261,667,428 | $178,902,455 | $123,605,332 | 4,167 |
| Educational Services | $47,707,321 | $29,274,947 | $22,046,565 | 754 |
| Health Care, etc. | $4,063,796,360 | $2,275,133,235 | $1,664,696,375 | 29,092 |
| Arts/Recreation | $42,286,035 | $24,215,080 | $15,179,602 | 536 |
| Accommodation | $48,068,740 | $30,359,204 | $13,372,507 | 412 |
| Eating/Drinking | $156,494,470 | $82,403,555 | $51,682,931 | 2,530 |
| Other services | $202,756,115 | $117,461,208 | $83,849,231 | 2,401 |
| Households | $3,975,610 | 347 | ||
| Total | $8,122,171,434 | $4,698,448,300 | $2,842,561,222 | 59,285 |
Source: TXP, Inc. Note: See definitions of economic impact terms used.
Construction
In FY 2017-18, Vanderbilt (the university and VUMC combined) spent $354 million on construction, building and leasehold improvements. These expenditures directly supported hundreds of local jobs in the construction and building maintenance sector. The estimated total economic output impact of Vanderbilt-related construction spending that year was approximately $777.9 million. The increase in regional economic activity supported almost 6,000 total jobs with labor income of more than $283.8 million.
Table 4: Vanderbilt Economic Impact FY 2017-18: Construction
| Industry Sector | Output | Value Added | Labor Income | Employment |
|---|---|---|---|---|
| Agriculture | $849,600 | $424,800 | $247,800 | 9 |
| Mining | $1,628,400 | $991,200 | $283,200 | 6 |
| Utilities | $6,690,600 | $3,681,600 | $1,026,600 | 11 |
| Construction | $357,504,600 | $215,479,800 | $164,680,800 | 2,885 |
| Durable Mfg. | $63,790,800 | $22,939,200 | $12,142,200 | 239 |
| Non-Durable Mfg. | $21,983,400 | $7,363,200 | $3,681,600 | 74 |
| Wholesale trade | $32,461,800 | $22,018,800 | $10,089,000 | 150 |
| Retail trade | $34,515,000 | $22,868,400 | $11,965,200 | 392 |
| Trans./Warehouse | $18,266,400 | $8,956,200 | $5,699,400 | 124 |
| Information | $16,248,600 | $9,310,200 | $3,256,800 | 63 |
| Finance/Insurance | $40,639,200 | $21,027,600 | $10,301,400 | 214 |
| Real Estate | $60,392,400 | $42,480,000 | $9,628,800 | 312 |
| Prof./Tech. Services | $22,231,200 | $13,983,000 | $9,451,800 | 161 |
| Mgmt. of Companies | $8,566,800 | $5,168,400 | $3,540,000 | 48 |
| Admin. Services | $12,956,400 | $8,460,600 | $5,664,000 | 193 |
| Educational Services | $4,743,600 | $2,902,800 | $2,194,800 | 75 |
| Health Care, etc. | $38,019,600 | $22,726,800 | $16,744,200 | 332 |
| Arts/Recreation | $3,752,400 | $2,159,400 | $1,380,600 | 49 |
| Accommodation | $4,743,600 | $3,009,000 | $1,309,800 | 41 |
| Eating/Drinking | $12,390,000 | $6,549,000 | $4,035,600 | 201 |
| Other services | $15,505,200 | $8,673,000 | $6,159,600 | 185 |
| Households | $389,400 | 35 | ||
| Total | $777,879,600 | $451,562,400 | $283,872,600 | 5,796 |
Source: TXP, Inc. Note: See definitions of economic impact terms used.
Student and Visitor Spending
In FY 2017-18, Vanderbilt-related off-campus student and visitor spending was about $203 million ($167.1 million of visitor and $35.9 million of student spending). The approach taken in this analysis was conservative, and likely undercounted the impact of this spending. The estimated total economic output impact of Vanderbilt-related student and visitor spending that year was approximately $372.3 million. The increase in regional economic activity supported approximately 3,400 total jobs with labor income exceeding $111.1 million.
Table 5: Vanderbilt Economic Impact FY 2017-18: Student and Visitor Spending
| Industry Sector | Output | Value Added | Labor Income | Employment |
|---|---|---|---|---|
| Agriculture | $525,007 | $224,699 | $120,554 | 5 |
| Mining | $179,754 | $108,961 | $23,748 | 1 |
| Utilities | $4,785,880 | $2,640,692 | $735,076 | 7 |
| Construction | $2,495,664 | $1,406,786 | $789,849 | 14 |
| Durable Mfg. | $5,789,990 | $2,021,457 | $1,077,290 | 22 |
| Non-Durable Mfg. | $13,389,733 | $4,339,039 | $2,308,550 | 49 |
| Wholesale trade | $11,541,328 | $7,831,993 | $3,589,195 | 53 |
| Retail trade | $22,892,764 | $15,090,663 | $7,754,793 | 270 |
| Trans./Warehouse | $8,407,995 | $4,471,090 | $2,911,744 | 63 |
| Information | $11,183,963 | $6,365,693 | $2,474,404 | 49 |
| Finance/Insurance | $24,864,289 | $12,975,456 | $6,328,380 | 127 |
| Real Estate | $52,572,671 | $36,352,662 | $9,401,613 | 268 |
| Prof./Tech. Services | $12,846,688 | $8,460,434 | $5,433,879 | 97 |
| Mgmt. of Companies | $9,317,593 | $5,608,376 | $3,857,388 | 52 |
| Admin. Services | $9,156,476 | $5,959,695 | $3,924,700 | 135 |
| Educational Services | $2,485,189 | $1,515,709 | $1,153,383 | 39 |
| Health Care, etc. | $19,607,626 | $11,719,669 | $8,631,135 | 172 |
| Arts/Recreation | $32,013,471 | $21,814,770 | $9,706,566 | 455 |
| Accommodation | $71,638,556 | $45,338,491 | $19,847,675 | 614 |
| Eating/Drinking | $47,352,187 | $24,757,913 | $17,176,357 | 754 |
| Other services | $9,267,266 | $5,229,331 | $3,678,552 | 107 |
| Households | $207,749 | 18 | ||
| Total | $372,314,092 | $224,441,329 | $111,132,579 | 3,372 |
Source: TXP, Inc. Note: See definitions of economic impact terms used.
Total Economic Impact
For FY 2017-18, the aggregate economic impact of Vanderbilt was approximately $11.9 billion. The increase in regional economic activity supported about 79,200 total jobs with labor income of approximately $4.2 billion.
Table 6: Vanderbilt Economic Impact FY 2017-18: Total
| Industry Sector | Output | Value Added | Labor Income | Employment |
|---|---|---|---|---|
| Agriculture | $13,297,221 | $5,828,013 | $3,433,343 | 108 |
| Mining | $5,902,832 | $3,629,251 | $924,503 | 18 |
| Utilities | $138,284,835 | $75,808,531 | $21,688,426 | 179 |
| Construction | $426,113,820 | $254,097,998 | $186,760,577 | 3,197 |
| Durable Mfg. | $199,652,879 | $72,774,819 | $37,821,904 | 658 |
| Non-Durable Mfg. | $335,129,891 | $110,096,946 | $58,351,106 | 1,022 |
| Wholesale trade | $375,946,423 | $255,080,838 | $118,154,985 | 1,550 |
| Retail trade | $474,363,563 | $315,929,736 | $167,545,046 | 4,698 |
| Trans./Warehouse | $230,818,849 | $119,775,326 | $78,434,138 | 1,511 |
| Information | $300,104,390 | $171,643,079 | $61,509,929 | 1,026 |
| Finance/Insurance | $971,524,855 | $509,659,015 | $246,272,255 | 4,323 |
| Real Estate | $1,210,764,822 | $848,834,388 | $195,434,244 | 5,218 |
| Prof./Tech. Services | $435,443,823 | $286,826,231 | $196,259,861 | 3,163 |
| Mgmt. of Companies | $151,095,245 | $90,631,004 | $63,295,543 | 757 |
| Admin. Services | $344,187,220 | $232,310,480 | $160,600,547 | 4,864 |
| Educational Services | $1,279,198,965 | $778,070,301 | $594,015,903 | 7,340 |
| Health Care, etc. | $4,245,847,391 | $2,383,945,189 | $1,748,342,572 | 30,052 |
| Arts/Recreation | $94,176,461 | $57,815,850 | $32,926,295 | 1,127 |
| Accommodation | $144,546,424 | $91,461,940 | $40,421,102 | 1,139 |
| Eating/Drinking | $262,925,668 | $138,378,630 | $89,159,502 | 3,801 |
| Other services | $300,931,406 | $170,952,931 | $122,374,577 | 3,003 |
| Households | $0 | $5,896,417 | $5,981,505 | 447 |
| Total | $11,940,256,983 | $6,979,446,914 | $4,229,707,863 | 79,199 |
Source: TXP, Inc. Note: See definitions of economic impact terms used.
State of Tennessee Tax Revenue Impact
As a not-for-profit, Vanderbilt itself is not subject to state and local taxes. However, tax revenue does accrue from activity associated with the indirect and induced economic effects described and measured above. To provide an “order of magnitude” estimate for state tax revenue attributable to Vanderbilt, the analysis used the ratio of state government tax collections to state GDP. Two datasets were used to derive the ratio: 1) U.S. Department of Commerce Bureau of Economic Analysis GDP estimates by metropolitan area, and 2) the U.S. Census Bureau State Government Tax Collections report.
Note: In this survey, “taxes” are defined as all compulsory contributions exacted by a government for public purposes, except employer and employee assessments for retirement and social insurance purposes, which are classified as insurance trust revenue. Outside the scope of this collection are data on the unemployment compensation “taxes” imposed by each of the state governments. However, all receipts from licenses and compulsory fees, including those that are imposed for regulatory purposes, as well as those designated to provide revenue, are included.
Table 7: Tennessee Tax Revenue as a Percent of State GDP ($Billions)
| Tennessee | 2014 | 2015 | 2016 | 2017 | 2018 |
|---|---|---|---|---|---|
| Tax Revenue | $11.8 | $12.7 | $13.5 | $14.0 | $14.6 |
| GDP | $304.2 | $322.7 | $334.4 | $347.8 | $365.6 |
| Tax Revenue as % | 3.9% | 3.9% | 4.0% | 4.0% | 4.0% |
Source: U.S. Department of Commerce Bureau of Economic Analysis and U.S. Census Bureau
Over the past five years, the average state tax revenue as a percent of state GDP was 4.0 percent. Applying this percentage to total value added (or GDP) attributable to the total economic impact associated with Vanderbilt, the state received approximately $279.2 million in tax revenue for FY 2017-18.
Conclusion
Vanderbilt is a foundational element of the local and state economy, as tens of thousands of Tennesseans are employed, directly or indirectly, because of its presence. Substantial growth in the last couple of years has come from the expansion of VUMC, with direct job counts about 20 percent higher than the last time this analysis was done two years ago, and overall capital and operations spending rising significantly as well. However, the impact extends far beyond these calculations, as the university has a direct role in creating new products and companies in the local economy and beyond. For example, over the past decade, Vanderbilt researchers and their innovations have helped to position the university as a world leader in numerous medical research sectors such as biomedical informatics, medical imaging, personalized medicine, and drug discovery and development. The commercialization of these results is impressive: 273 patent applications filed, 81 licenses and options executed, 59 patents issued, $17.2 million in revenue and five startups created in 2018 alone.
More broadly, Vanderbilt is a cornerstone element of the modern Tennessee economy. Traditional economic development is focused on attracting and retaining new production facilities or company headquarters. While these elements remain a crucial piece of the puzzle, other factors play an increasing role in the mix. Specifically, growing regions require a highly capable workforce, innovation and entrepreneurship, clusters in knowledge industries and superior quality of life. Vanderbilt makes integral contributions to all of these factors each year, and the impact is growing. Put differently, the principal determinant of modern economic success is the ability to acquire, process and apply knowledge. Vanderbilt is a laboratory where this key element of the state’s (and nation’s) comparative advantage is incubated, both in terms of preparing the future labor force and via research that ultimately leads to new or improved products and services. Tennessee remains fortunate to have such a strong asset in its economic development portfolio.
1 As of Spring 2016, Vanderbilt University Medical Center (VUMC) operates as a fully independent, nonprofit entity, separate from Vanderbilt University. This positions VUMC for future growth and investment, while preserving its tightly woven connections to the university in research and teaching. For purposes of this study, the two institutions collectively comprise “Vanderbilt.”
Legal Disclaimer
TXP reserves the right to make changes, corrections and/or improvements at any time and without notice. In addition, TXP disclaims any and all liability for damages incurred directly or indirectly as a result of errors, omissions or discrepancies. TXP disclaims any liability due to errors, omissions or discrepancies made by third parties whose material TXP relied on in good faith to produce the report. Any statements involving matters of opinion or estimates, whether or not so expressly stated, are set forth as such and not as representations of fact, and no representation is made that such opinions or estimates will be realized. The information and expressions of opinion contained herein are subject to change without notice, and shall not, under any circumstances, create any implications that there has been no change or updates.