Nonlinear Dynamic Systems
Nonlinear functions
What's a linear function?
Well, gee Mikey, it's one that can be written in the form of a straight
line. Remember the formula ...
y = mx + b
where m is the slope and b is the y-intercept?
What's a nonlinear function?
Any function that ain't linear!
Is the Alpha model a linear model?
Yes, because qn+1 is a linear function of qn
But wait! Its output, the plot of its behavior over time (its
time series shown earlier) is not a straight line. Doesn't that make it
a nonlinear system?
No, what makes a dynamic system nonlinear ....
is whether the function specifying the change is nonlinear. Not whether
its behavior is nonlinear.
And y is a nonlinear function of x if
x is multiplied by another (non-constant) variable, or multiplied by itself
(i. e., raised to some power).
We illustrate nonlinear systems using ...
Logistic Difference Equation
... a model often used to introduce chaos. The Logistic Difference Equation,
or Logistic Map, though simple, displays the major chaotic concepts.
Growth model
We start, generally, with a model of growth.
xnew = r xold
We prefer to write this in terms of n:
xn+1 = r xn.
This says x changes from one time period, n, to the next, n+1, according
to r. If r is larger than one, x gets larger with successive iterations
If r is less than one, x diminishes. (In the "Alice" example
at the beginning, r is .5).
Let's set r to be larger than one...
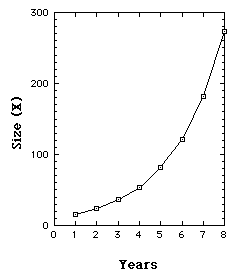
We start, year 1 (n=1), with a population of 16 [x1=16], and
since r=1.5, each year x is increased by 50%. So years 2, 3, 4, 5, ...
have magnitudes 24, 36, 54, ...
Our population is growing exponentially. By year 25 we have over a quarter
million.
Iterations of Growth model with r = 1.5
So far, notice, we have a linear model that produces unlimited
growth.
Limited Growth model - Logistic Map.
The Logistic Map prevents unlimited growth by inhibiting growth whenever
it achieves a high level. This is achieved with an additional term, [1
- xn].
The growth measure (x) is also rescaled so that the maximum value x can
achieve is transformed to 1. (So if the maximum size is 25 million, say,
x is expressed as a proportion of that maximum.)
Our new model is
xn+1 = r xn [1 - xn]
[r between 0 and 4.]
The [1-xn] term serves to inhibit growth because as x
approaches 1, [1-xn] approaches 0.
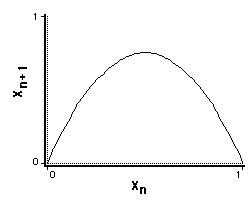
Plotting xn+1 vs. xn, we see we have a nonlinear
relation.
Limited growth (Verhulst) model. Xn+1 vs. xn,
r = 3.
We have to iterate this function to see how it will behave ...
Suppose r=3, and x1=.1 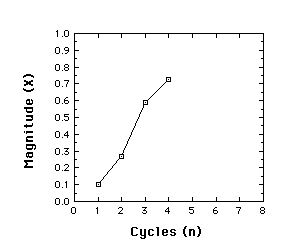
x2 = rx1[1-x1] = 3(.1)(.9) = .27
x3= r x2[1-x2]= 3(.27)(.73) = .591
x4= r x3[1-3]= 3(.591)(.409) = .725
Behavior of the Logistic map for r = 3, x1 = .1, iterated
to give x2, x3, and x4
It turns out that the logistic map is a very different animal,
depending on its control parameter r. To see this, we next examine the
time series produced at different values of r, starting near 0 and
ending at r=4. Along the way we see very different results, revealing and
introducing major features of a chaotic system.
When r is less than 1
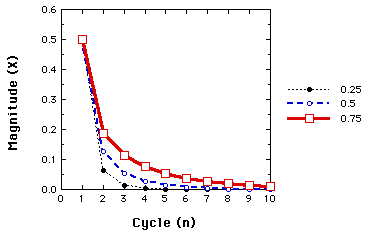
Behavior of the Logistic map for r=.25, .50, and .75. In all cases
x1=.5.
The same fates awaits any starting value. So long as r is less than
1, x goes toward 0. This illustrates a one-point attractor.
When r is between 1 and 3
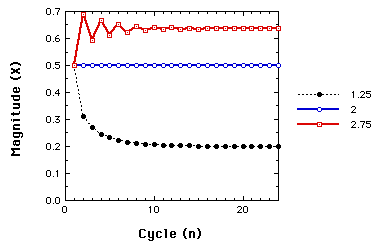
Behavior of the Logistic map for r=1.25, 2.00, and 2.75. In all cases
x1=.5.
Now, regardless, of the starting value, we have non-zero one-point attractors.
When r is larger than 3
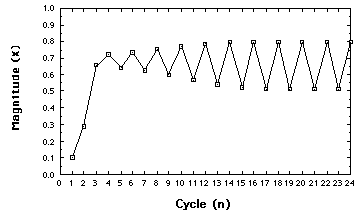
Behavior of the Logistic map for r=3.2.
Moving just beyond r=3, the system settles down to alternating between
two points. We have a two-point attractor. We have illustrated a
bifurcation, or period doubling, 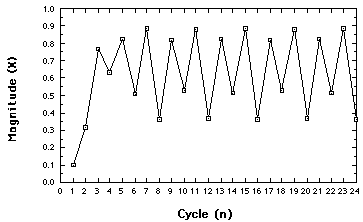
Behavior of the Logistic map for r= 3.54. Four-point attractor
Another bifurcation. The concept: an N-point attractor. 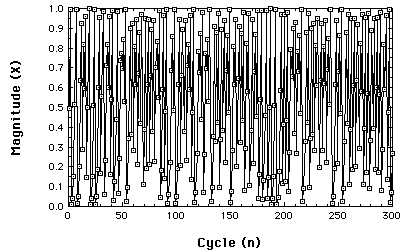
Chaotic behavior of the Logistic map at r= 3.99.
So, what is an attractor? Whatever the system "settles down
to".
Here is a very important concept from nonlinear dynamics: A system eventually
"settles down". But what it settles down to, its attractor, need
not have 'stability'; it can be very 'strange'.
Next Section: Bifurcation Diagram