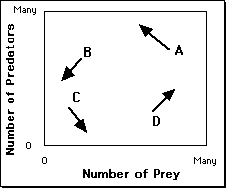
A = Too many predators.
B = Too few prey.
C = Few predator and prey; prey can grow.
D= Few predators, ample prey.
The phase-space of the predator-prey system.
Consider again the Logistic map
xn+1 = r xn[1- xn]
Multiply the right side out
xn+1= r xn - r xn2,
and replace the two r's with separate parameters, a and b,
xn+1= a xn - b xn2.
Now, separate parameters, a and b, govern growth and suppression, but we still have only one variable, x.
When we have a system with two or more variables,
This is a two-dimensional dynamic system in which two variables grow, but one grows at the expense of the other. The number of predators is represented by y, the number of prey by x.
We plot next the phase space of the system, which is a two-dimension plot of the possible states of the system.
A = Too many predators.
B = Too few prey.
C = Few predator and prey; prey can grow.
D= Few predators, ample prey.
The phase-space of the predator-prey system.
Four states are shown. At Point A there are a large number of predators and a large number of prey. Drawn from point A is an arrow, or vector, showing how the system would change from that point. Many prey would be eaten, to the benefit of the predator. The arrow from point A, therefore, points in the direction of a smaller value of x and a larger value of y.
At Point B there are many predators but few prey. The vector shows that both decrease; the predators because there are too few prey, the prey because the number of predators is still to the prey's disadvantage. At Point C, since there are a small number of predators the number of prey can increase, but there are still too few prey to sustain the predator population. Finally, at point D, having many prey is advantageous to the predators, but the number of prey is still too small to inhibit prey growth, so their numbers increase. The full trajectory (somewhat idealized) is shown next.
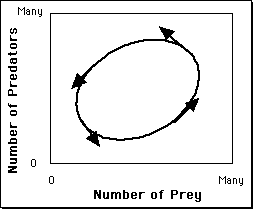
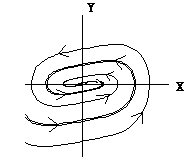
The phase-space of the predator-prey system.
An attractor that forms a loop like this is called a limit cycle. However, in this case the system doeasn't start outside the loop and move into it as a final attractor. In this system any starting state is already in the final loop. This is shown in the next figure, which shows loops from four different starting states.
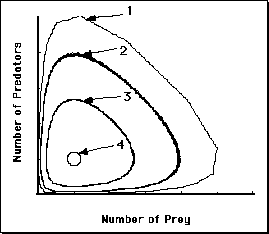
Phase-portrait of the predator-prey system, showing the influence of starting state.
Points 1-4 start with about the same number of prey but with different numbers of predators.
Let's look at this system over time, that is, as two time series.
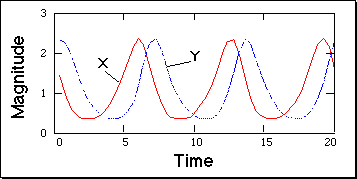
The time series of the predator-prey system.
This figures shows how the two variables oscillate, out of phase.
For example, the Predator-prey system is typically presented as a set of two differential equations:
dx/dt = (a-by)x
dy/dt = (cx-d)y
Other types of two-dimensional interactions are possible, as nicely categorized by van Geert (1991).
Abraham, Abraham, & Shaw (1990) used the Buckling Column system to discuss psychological phenomena that exhibit oscillations (for example, mood swings, states of consciousness, attitude changes). The model is a single, flexible, column that supports a mass within a horizontally constrained space. If the mass of the object is sufficiently heavy, the column will "give", or buckle. There are two dimensions, x representing the sideways displacement of the column, and y the velocity of its movement.
Shown next are two situations, differing in the magnitude of the mass.
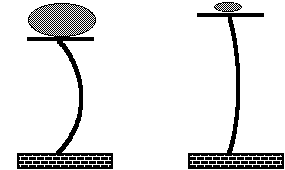
The buckling column model (Abraham, Abraham, & Shaw, 1990).
The mass on the left is larger than the mass on the right.
What are the dynamics? The column is elastic, so an initial give is
followed by a springy return and bouncing (oscillations). If there is resistance
(friction), the bouncing will diminish and the mass will come to rest.
The equations are given for completeness only:
dx/dt = y
dy/dt = (1 - m)(ax3 + b + cy)
The parameters m and c represent mass and friction respectively. If
there is friction (c>0), and mass is small, the column eventually returns
to the upright position (x=0, y=0), illustrated next with two trajectories.
Phase portrait of the buckling column model.
With a heavy mass, the column comes to rest in one of two positions
(two-point attractor), again illustrated with two trajectories. 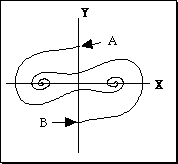
Phase portrait of the buckling column model.
Starting at point A, the system comes to rest buckled slightly to the right, starting at B ends up buckled to the left. Now we can introduce another major concept...
With sufficient mass, the buckling column can end up in one of two states,
buckled to the left or to the right. What determines which is its fate?
For a given set of parameter values, the fate is determined entirely by
where it starts, the initial values of x and y. In fact, each point in
phase space can be classified according to its attractor. The set of points
associated with a given attractor is called that attractors' basin of
attraction. For the two-point attractor illustrated here, there are
two basins of attraction. These are shown in the next figure, which has
the phase space shaded according to attractor. 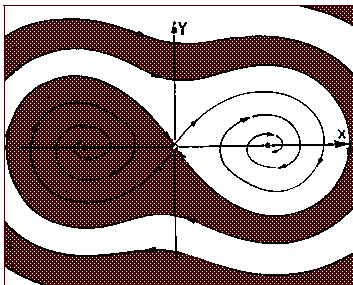
The basins of attraction for the buckling column system. Reproduced from Abraham et al (1990).
The basin of attraction for the positive attractor (the one on the right) are shaded. The basin of attraction for the other attractor is unshaded in the figure. The term seperatrix is used to refer to the boundary between basins of attraction.
Is the buckling column system a chaotic system? Why (not)?
Lorenz's model of atmospheric dynamics is a classic in the chaos literature. The model nicely illustrates a three-dimensional system.
dx/dt = a(y-x)
dy/dt = x(b-z) - y
dz/dt = xy-cz
There are three variables reflecting temperature differences and air
movement, but the details are irrelevant to us. We are interested in the
trajectories of the system in its phase space for a=10, b=28, c=8/3. Here
we plot part of a trajectory starting from (5,5,5). 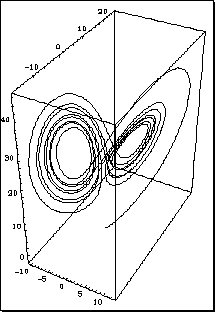
The Lorenz system. Only a portion of one trajectory is shown.
Although the figure suggests that a trajectory may intersect with earlier passes, in fact it never does. Although not demonstrated here, the Lorenz system shows sensitivity to initial conditions. This is chaos, the first strange attractor, and it has become the icon for chaos.
There are three kinds of limit points.